
Automotive claim frequency and costs are on the rise again.
The most recent data from the ISS Fast Track Plus™ data reveals Private Passenger Auto Collision losses experienced an increase in claim frequency of 4.3 percent for the rolling four quarters ending Q4 2014 versus the rolling 12 months ending Q4 2013.1 Property Damage Liability and Comprehensive losses were up 1.5 percent and 2.3 percent respectively.2
.
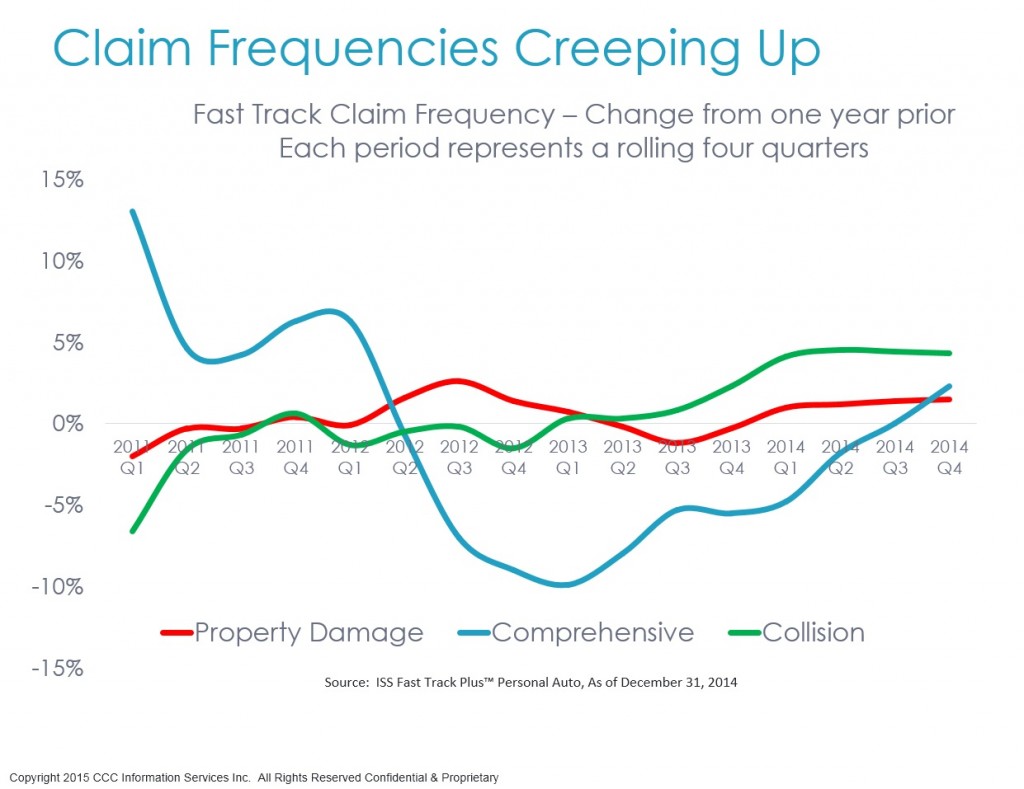
Paid claim costs were also up. For the 12 months ended Q4 2014 versus the 12 months ended Q3 2014, paid claim costs were up 1.5 percent for collision; 3.5 percent for property damage liability, and 7.2 percent for comprehensive.3 So what seems to be driving these increases? In previous articles we have discussed the impact of weather in many parts of the U.S., as well as improvements in key economic factors such as consumer spending, employment growth, miles driven, and new vehicle sales due to pent up demand and low interest rates. In this article, we’ll explore several of these factors in more detail.
Vehicle Fleet Shifts Continue
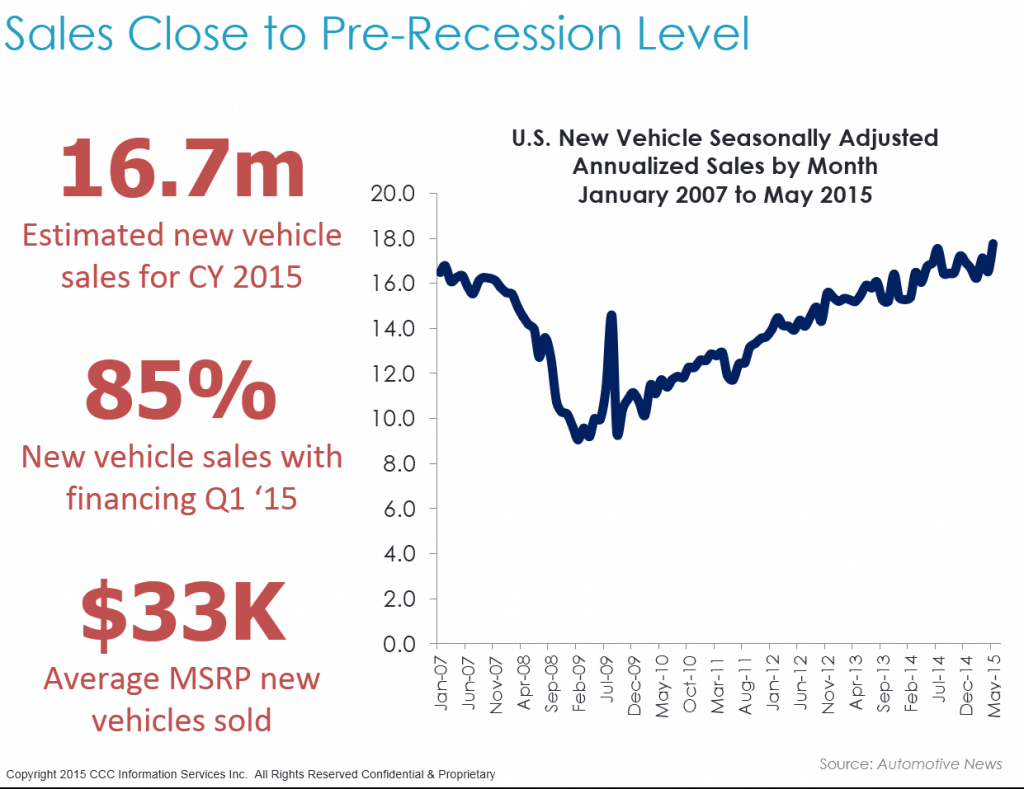
Despite negative growth for the U.S. economy in Q1 20154, auto sales remained strong, and are well on the way to nearly 17 million new vehicle sales for the full calendar year.5 In fact, the seasonally adjusted annualized sales rate for May was 17.7 million – a number last seen in July 2005.6 Data from Experian shows 85 percent of new vehicle purchases in Q1 2015 were financed with an overall average loan term of 67 months, and 29.5 percent of new vehicle loans financed were for loan terms between 73 and 84 months.7 With many customers using low interest rates to purchase loaded crossovers and pickups, and move up-market, the average MSRP of vehicles sold in May 2015 was $33,363, up 4.3 percent from the same time the prior year.8 With continued strong vehicle sales (new vehicle registrations up 1.8 percent Q1 ’15 vs Q1 ‘14), and vehicle scrappage rates at record lows, the number of vehicles in operation in the U.S. is growing again.9 Experian reports growth of 2.4 percent to 253 million light duty vehicles in operation from Q1 2014 to Q1 2015.10
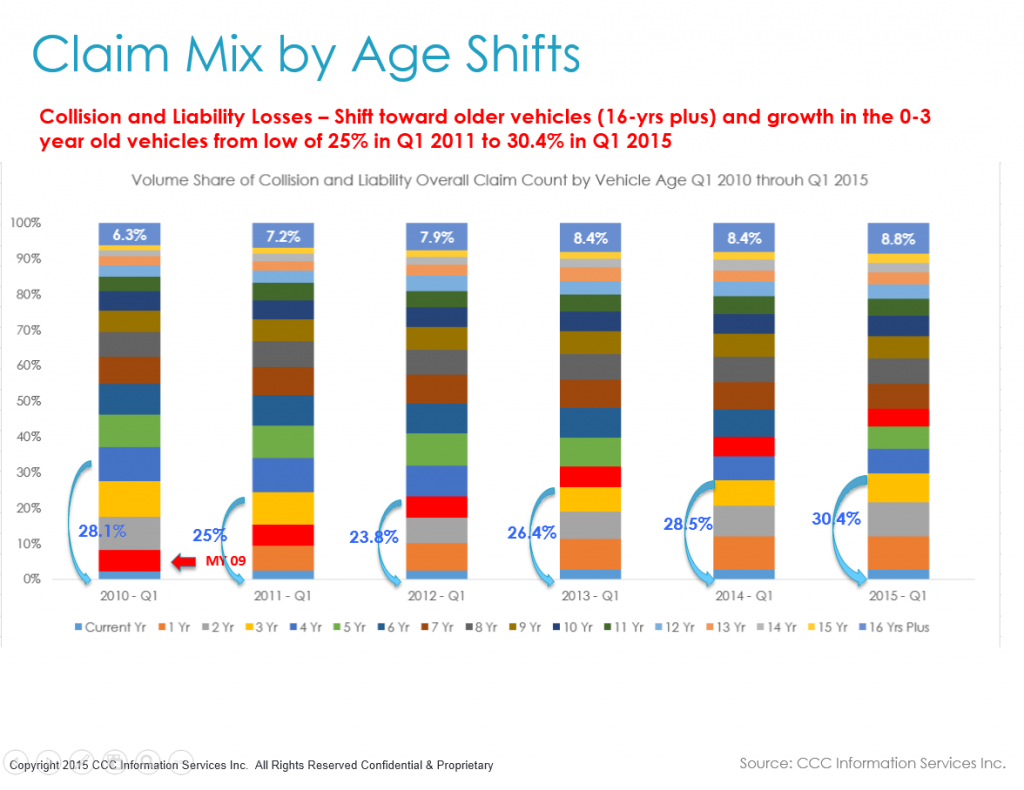
Analysis of overall claims data (including vehicles repaired and totaled with collision and liability loss coverage) reveals a shift in the mix of vehicles by age towards those in the 0-3 year age bracket and those 16-years plus.11 The significant drop-off in new vehicle sales in CY 2009 can also be seen as the MY 2009 vehicle share is much smaller than other model years.12
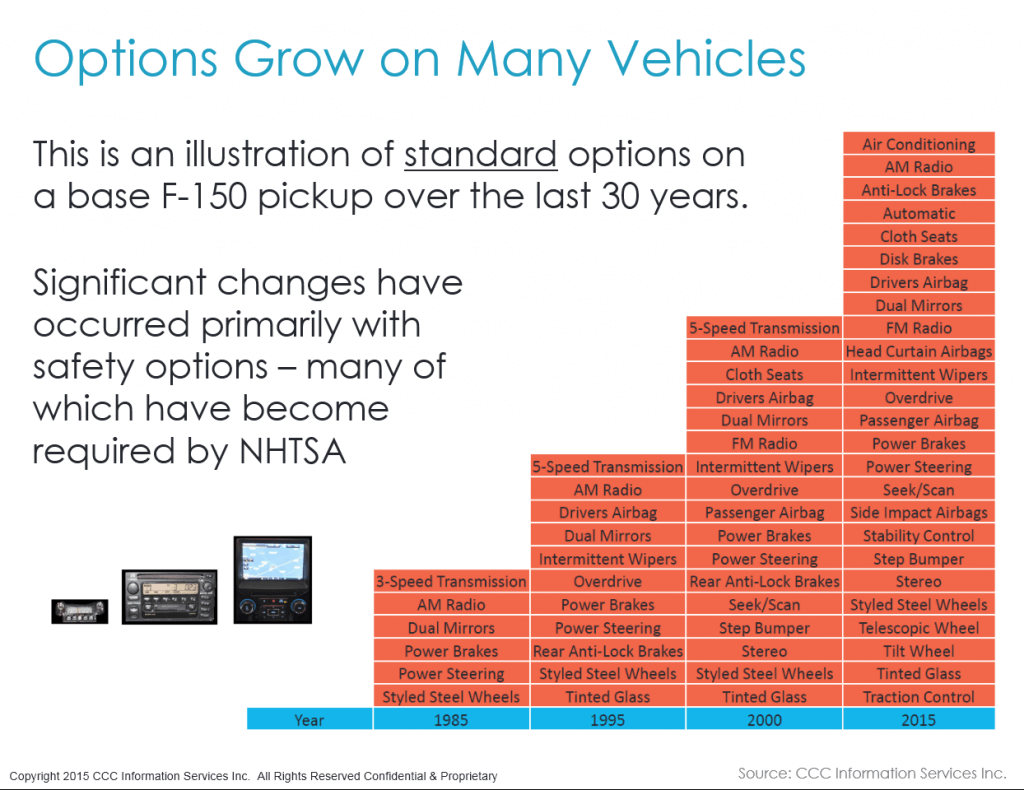
With growth of both the oldest and newest vehicles, the industry is experiencing pressure in repair costs for the newer vehicles and higher total loss frequency for the older vehicles at a time when used vehicle values remain elevated. Growth in the average number of parts replaced per claim as well as more labor hours per claim are largely account for the rise in repair costs.13 Increasing vehicle complexity – both in terms of the materials used in the construction of the vehicles as well as an increased number of standard options, are also helping to lift costs.
A comparison of the change in the standard options included in several high volume vehicles illustrates how changes in vehicle safety standards and the need to meet consumer demands for comfort and convenience. For example, the Hyundai Sonata GLS MY 1989 had 23 standard options, but by the MY 2014, this number grew to 44.14 The 1995 Honda Odyssey had 29 standard options, while the MY 2015 has 52.15 And while the 2015 Ford F150 has been in the spotlight for the introduction of its aluminum body panels, the base model for the F150, has seen significant growth in the number of standard options over time.16
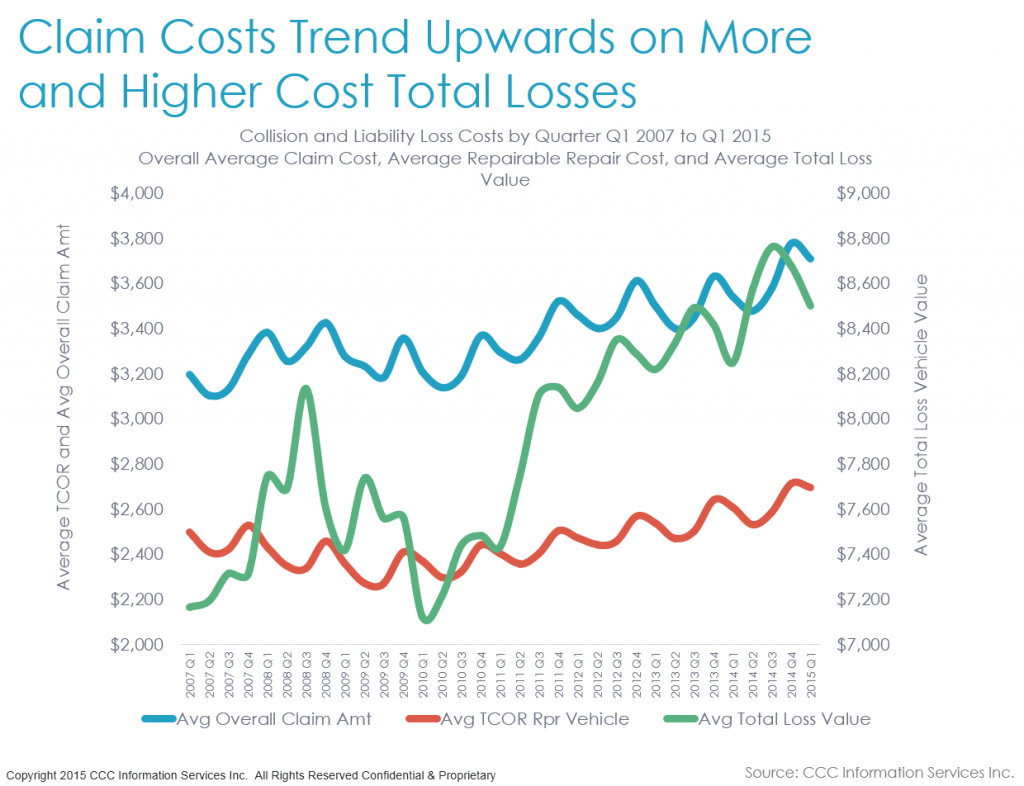
Total loss costs remain elevated, as demand for used vehicles remains strong, and supply on the wholesale side has not surged beyond demand.17 With the majority of total loss vehicles aged 7-years plus, where additional supply is smaller than for newer models, prices remain steady.18 Subsequently as repair costs rise across all vehicle ages, older model year vehicles (which now make up a larger share of overall claims volume) will quickly reach the point where the repair cost exceeds the total loss threshold, and those vehicles will be totaled.19 For example, in Q1 2015, the average repair cost for repairable vehicles with a collision or liability loss aged 16-years plus was $2,395, while the average total loss vehicle value for that same subset of vehicles was $3,095.20
Combined these factors are driving up overall claim costs. But what about frequency?
Consumers on the Road Again
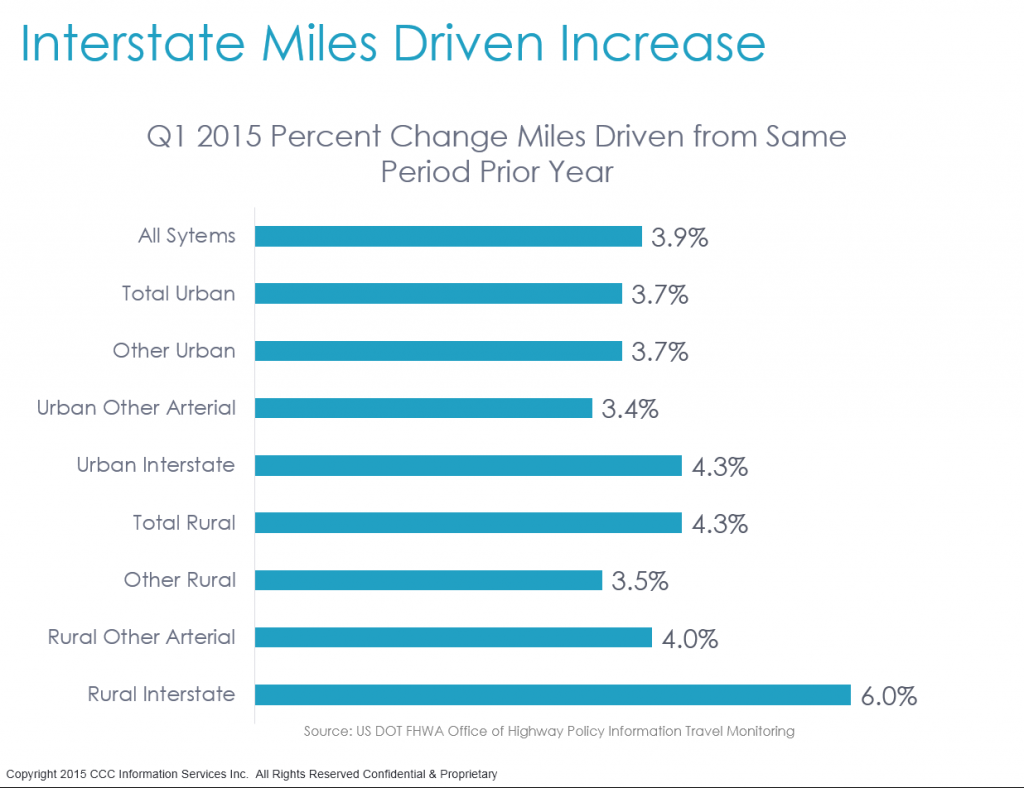
Miles driven have finally returned to their pre-recession levels as well; the rolling 12 months ending March 2015 are 0.8 percent higher than the pre-recession peak in November 2007.21 For the first quarter of 2015 miles driven are up 3.9 percent overall from the same period in 2014.22 With more people back at work, and gas prices low, consumers are driving more, taking more trips. Data from AAA and the U.S. Energy Information Administration showed that gasoline demand for the week leading up to Memorial Day was the highest weekly since August 2007.23 Gasoline prices have begun to rise but are still well below their peak. The decline in price per barrel of oil from $104 in July 2014 to $47 per barrel in January 2015 was the largest six-monthly drop since 1986, and as of June 1, 2015, gas prices averaged $2.66 per gallon.24
Comparing miles driven by type of road in Q1 2015 versus Q1 2014 reveals that the largest increases have been on Rural Interstate and Urban interstate roads.25
Recent data from the National Safety Council (NSC)also shows a rise in vehicle fatalities of 11 percent in Q1 2015 versus Q1 2014; following on monthly year-over-year increases of 2 percent, 4 percent, and 11 percent in Oct 2014, Nov 2014, and Dec 2014.26
Certainly the increases in both miles driven and vehicle fatalities are also a by-product of simply more vehicles on the road. Despite the rise in deaths, the NSC’s estimated annual mileage death rate of 1.2 deaths per 100 million vehicle miles traveled is unchanged from the preliminary 2014 rate.27 Additionally, dividing each odometer average by the age of the vehicle, this suggests that miles driven per year per loss vehicle continue to be on the slight decline.28
Summary
U.S. vehicle population has begun to grow again, and more miles are being driven with the greatest growth on interstates where accidents occur at higher speeds. Whether or not this is helping to drive up repair costs, increasing vehicle complexity alone certainly is. With a ‘hangover’ of an older fleet still on the road in the U.S. driving up total loss frequency, the industry is the unfortunate recipient of a market where frequency has returned to pre-recession levels, and costs are rising for both repairs and increased volume of total losses.
Download this article
Fill out the form below to download this Crash Course 2015 Update now!
No Fields Found.
Sources:
1 ISS Fast Track Plus™ Private Passenger Auto Loss Data and Trends Multi-State as of December 31, 2014.
2 Ibid.
3 Ibid.
4 www.bea.gov.
5 Boudette, Neil E. “Pickup sales soar, thanks largely to GM.” June 8, 2015. www.autonews.com.
6 Ibid.
7 Zabritski, Melinda, Sr. Director, Experian Automotive. “State of the Automotive Finance Market First Quarter 2015”
8 Boudette, Neil E. “17.78 Million! What made May’s sales rate spike?” June 8, 2015. www.autonews.com.
9 Zabritski, Melinda, Sr. Director, and Miller, Marty, Senior Product Manager, Experian Automotive. “Experian Automotive Quarterly Briefing:
First Quarter 2015 automotive market share trends and registrations.”
10 Ibid.
11 CCC Intelligent Solutions
12 Ibid.
13 Ibid.
14 Ibid.
15 Ibid.
16 http://www.nhtsa.gov/Research/Crashworthiness.
17 http://www.manheim.com/services/consulting.
18 CCC Intelligent Solutions
19 Ibid.
20 Ibid.
21 “Traffic Volume Trends – March 2015.” USDOT FHWA Office of Highway Policy Information.
22 Ibid.
23 http://newsroom.aaa.com/tag/memorial-day-travel-forecast/.
24 “Better than it looks.” The Economist, Volume 415, Number 8942, p.24.
25 Ibid.
26 National Safety Council Motor Vehicle Fatality Estimates, Mar 2015.
27 Ibid.
28 CCC Intelligent Solutions