Repairable appraisal counts for the industry in September 2020 remained down from the same month last year, with the decline in September increasing again versus the August year-over-year change. Significant weather events in states such as Iowa, Illinois, and the Northeast in August 2020 led to large upticks in volume versus August 2019; while states such as Colorado, North Carolina, South Carolina, and Texas actually saw fewer comprehensive claims in September 2020 versus September 2019. Among the major weather events in September 2019 that led to a larger number of comprehensive claims than seen this year include Hurricane Dorian (NC & SC), severe convective storms (CO), and Tropical Storm Imelda (TX). This September 2020, states with significant increase in comprehensive losses include California, Oregon, Utah and Washington due to wildfires, and Alabama, Florida and Louisiana from Hurricanes Sally and Laura (see Figures 1 and 2).
Figure 1

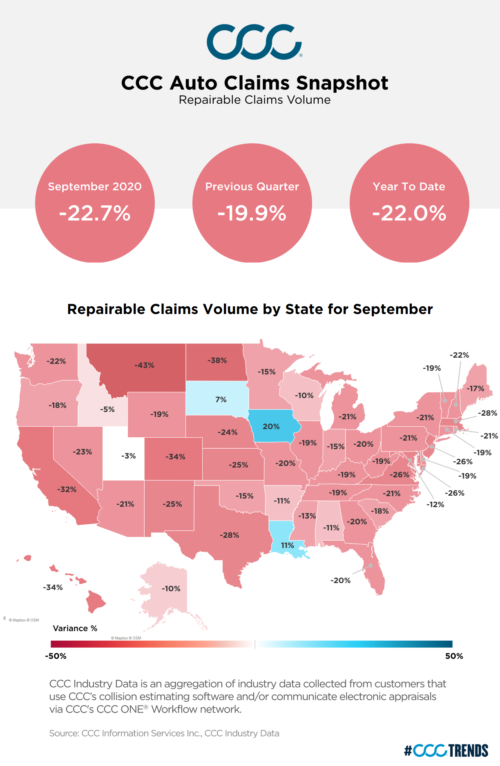
Figure 2

Year to date volume remains down more than 20 percent across all loss categories, while non-comprehensive losses remain down more than 25 percent. Labor Day Weekend occurred one week earlier in 2020 than in 2019, and the U.S. Bureau of Transportation Studies estimates Americans took 2.8 billion fewer trips over Labor Day Weekend 2020 versus Labor Day Weekend 2019. Overall, the total number of trips and the total number of local trips (less than 50 miles) were down 38 percent Labor Day Weekend 2020 from last year.
Among the areas of the country that continue to see their September 2020 non-comprehensive losses down most include numerous markets in California, Texas, and Florida where severe weather and elevated counts of COVID-19 cases continue to keep people off the roads.
The Dallas Fed Mobility and Engagement Index (MEI) summarizes information in seven different variables based on geolocation data collected from a large sample of mobile devices to gain insight into the economic impact of the pandemic. Among the variables included are how many, for how long, and how far mobile devices are leaving home measured daily and indexed weekly. The MEI measures the deviation from normal mobility behaviors induced by COVID-19. Figure 3 shows the national data, as well as data on states where claim counts are either down most or much less by week through September. With traffic levels still down and the percent of people still working at home still up, claim counts for the full year 2020 will remain down, unless the U.S. sees more significant weather events in the fourth quarter.
Figure 3
