(This article was originally featured in Digital Insurance)
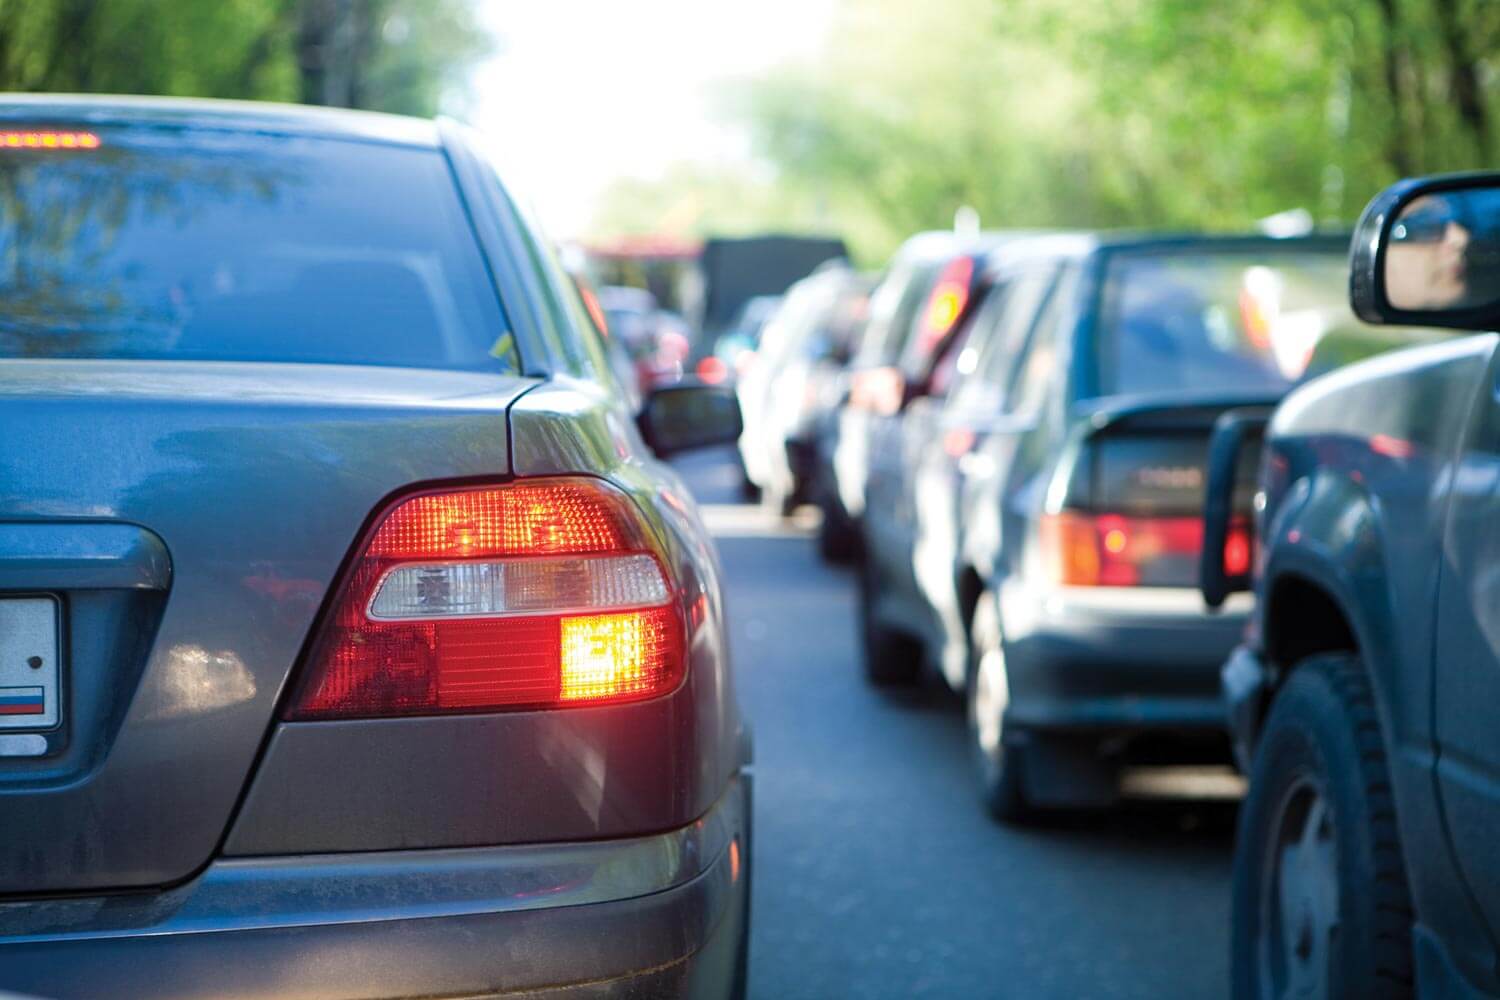
An editorial in the NY Times “The Trucks are Killing Us” recently caught my attention.
With data from the National Safety Council (NSC) reporting traffic fatalities up 14 percent year-to-date through June 2015 the title resonates. Better employment, inexpensive gas, and driver distraction are all factors the NSC attributes to the rise in the fatality rate per 100 million miles driven back to 2007 levels.
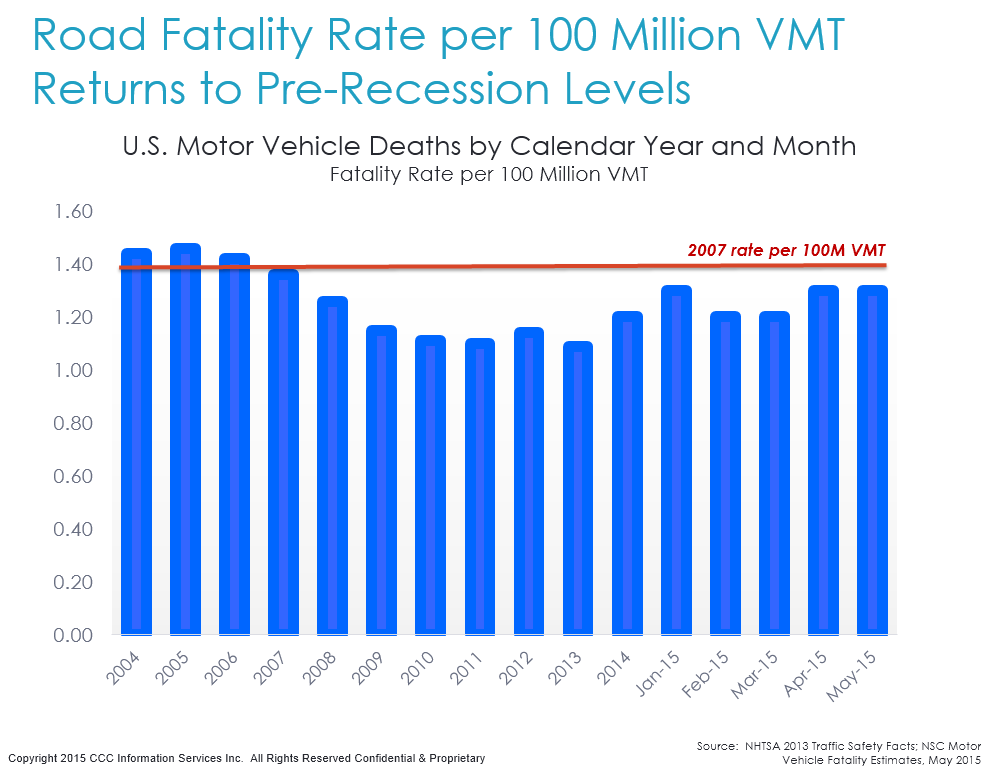
The chart here illustrates how the United States (U.S.) motor vehicle fatality rate per 100 million vehicle miles traveled was 1.46 in CY 2005, fell to a low of 1.10 in CY 2011, before returning to 1.3 by May 2015, just below the CY 2007 level of 1.36.
So what’s driving the increase?
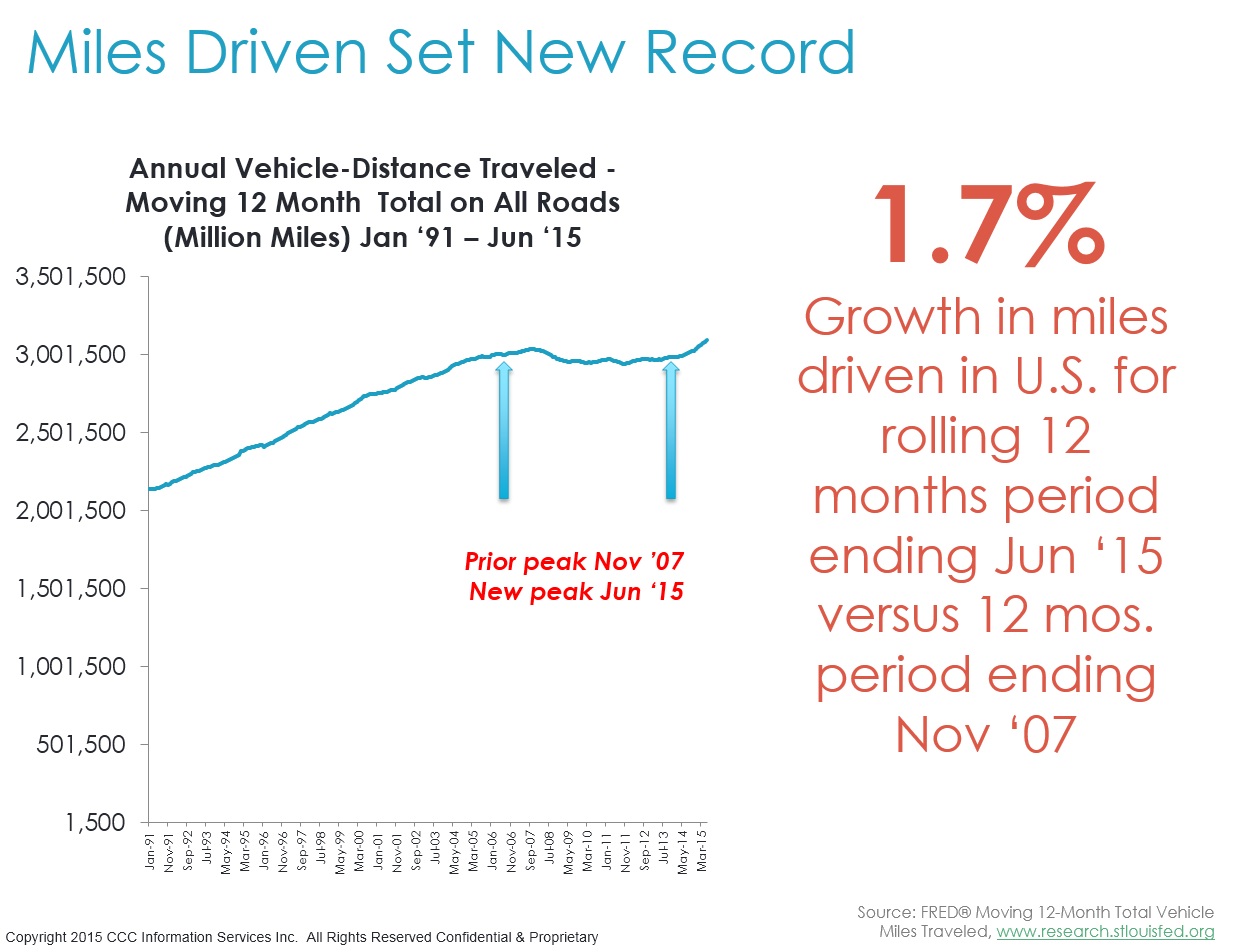
As the employment picture in the U.S. has improved, and gas prices have fallen sharply, miles driven in the U.S. has returned to its pre-recession levels and then some.
For the twelve month period ending June 2015, miles driven exceeded by 1.7 percent the pre-recession peak set in November 2007.
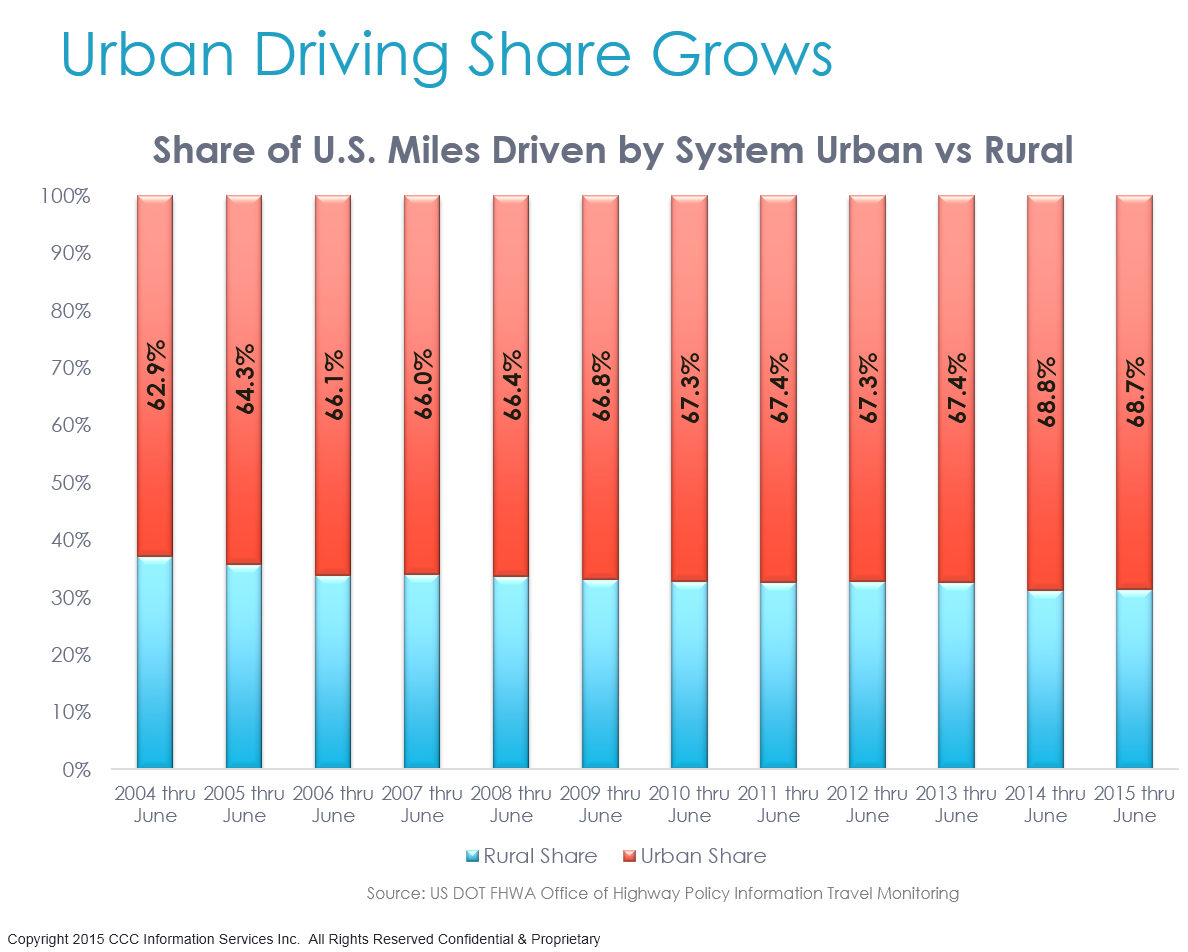
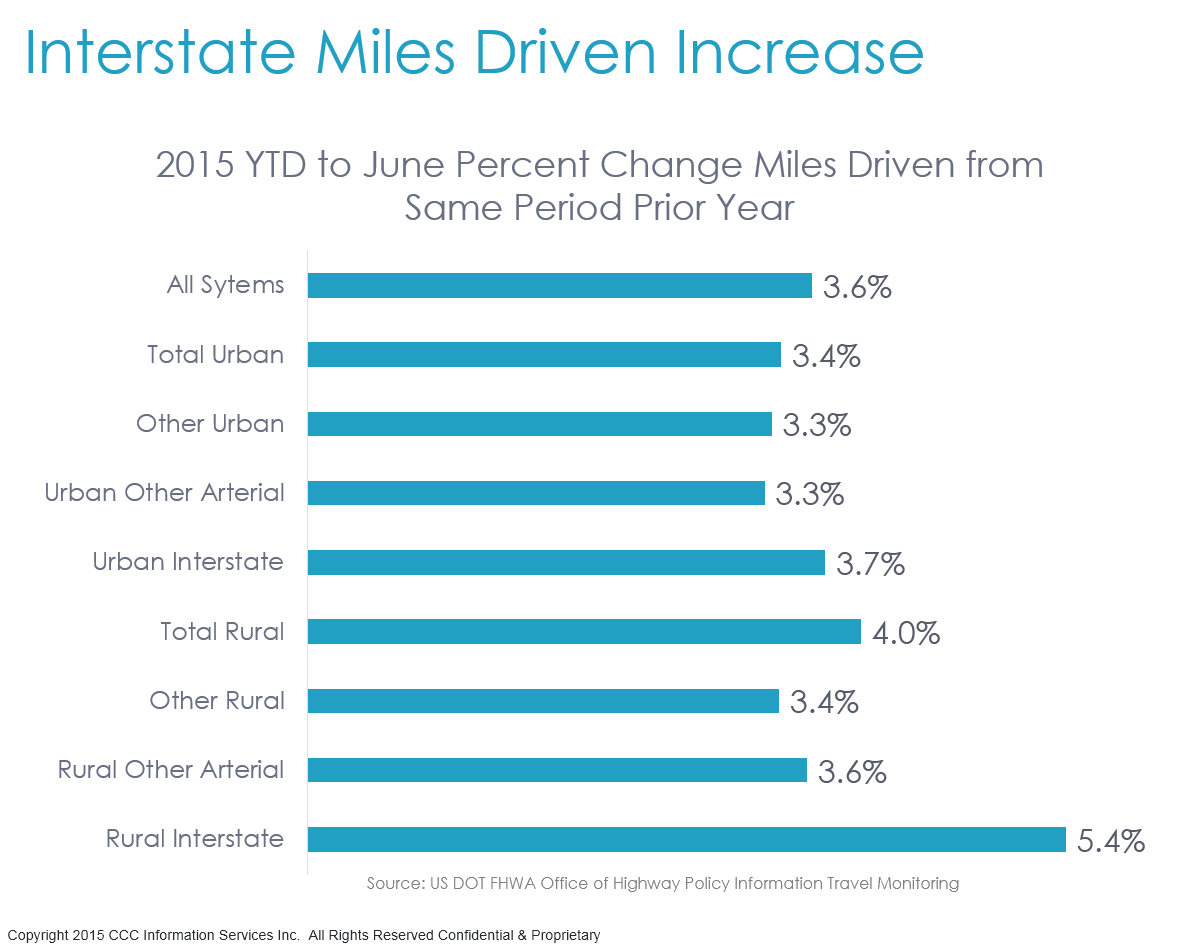
As the U.S. population has become increasingly less rural, there has been an increase in the share of miles driven in the U.S. classified as ‘urban.’ Rural roadways accounts for just under one-third of miles driven.
Worth noting however, are the mileage growth rates for all rural roads that increased at a slightly higher pace year-to-date through June 2015 than urban roads. The largest increases occurred on rural interstate roadways followed by urban interstate. Perhaps this is why fatality rates are rising even as rural road usage declines. Historically rural road fatalities have accounted for a higher share of overall motor vehicle traffic fatalities annually. In 2013 for example, 54 percent of the motor vehicle traffic fatalities occurred in rural areas, while the remainder occurred in urban areas.
Yet overall, data from the U.S. Department of Transportation reveals the U.S. population has become increasingly urban, with most growth occurring in the suburban areas. Three quarters of all population growth since 1980 has occurred in the suburbs. And even while the annual population growth rate of large cities in the U.S. between 2010 and 2013 was double what it had been in the previous decade, outpacing the growth rate in suburbs, approximately 50 percent of all Americans still live in the suburbs.
A recent study by Michael Sivak of the University of Michigan Transportation Research Institute of the top 30 metro areas in the U.S. revealed a broad range among them in terms of who, how, and average time of those that commute to work. Using data from the American Community Survey from the U.S. Census Bureau, he identified less than 1 percent of workers in Oklahoma City use public transportation (the lowest of all 30 metro areas), versus 56.7 percent in New York City, with the average across the U.S. at only 5.2 percent. He also found that the mean travel time of the population that commutes to work was 25.8 minutes each way.
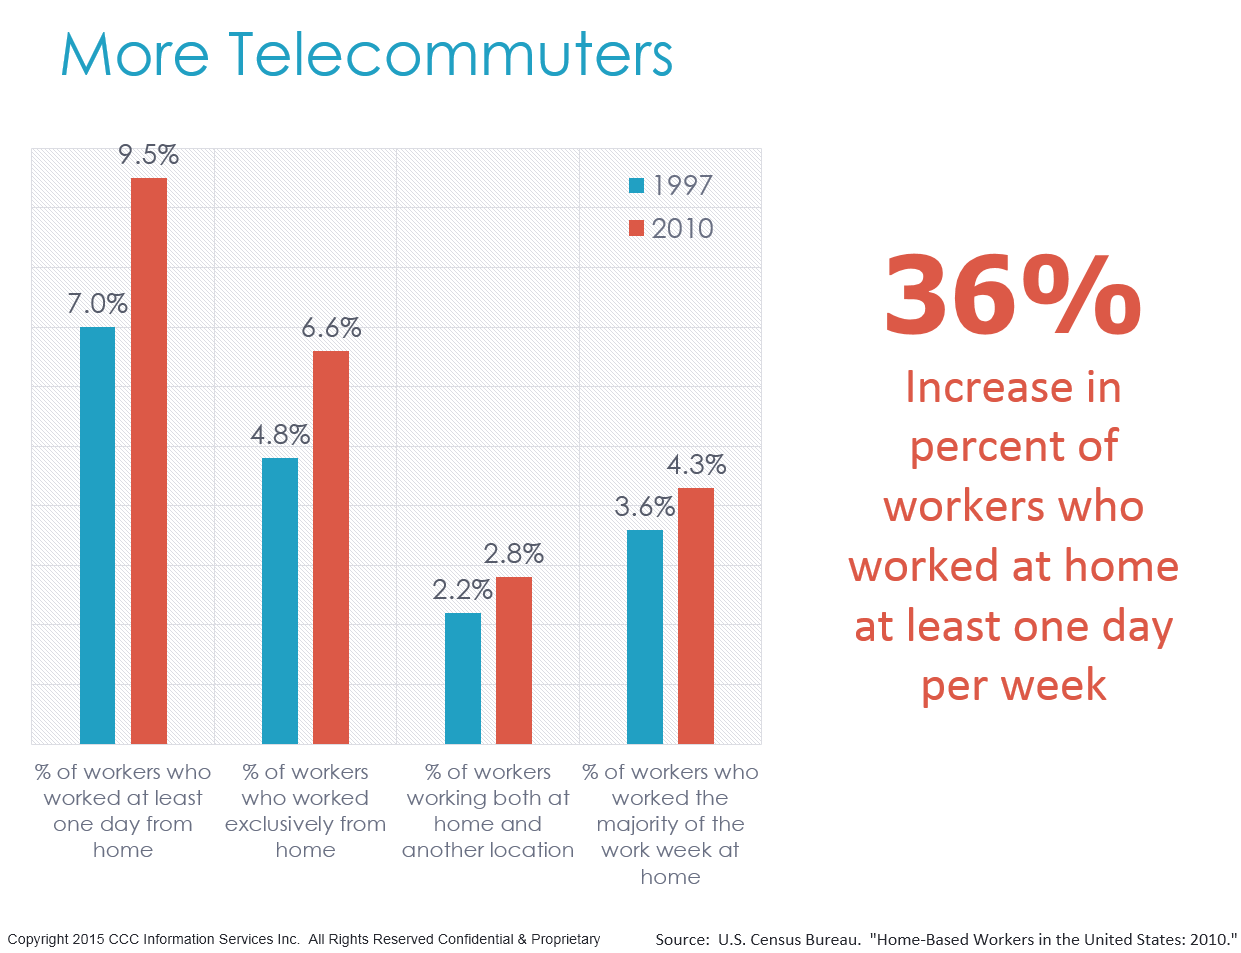
Technology has helped some commuters – according to data from the U.S. Census Bureau, in CY 2010 at least 9 percent of workers reported working from home (telecommuting) at least one day per week. And bicycle commuting has also increased – combined rate across the 50 largest U.S. cities increased from 0.6 percent in CY 2000 to 1 percent in CY 2008-2012.
Yet more than 85 percent of individuals in the U.S. still use a private passenger vehicle as their primary means of transportation to work, and with employment rates improving, the U.S. roads are becoming busier.
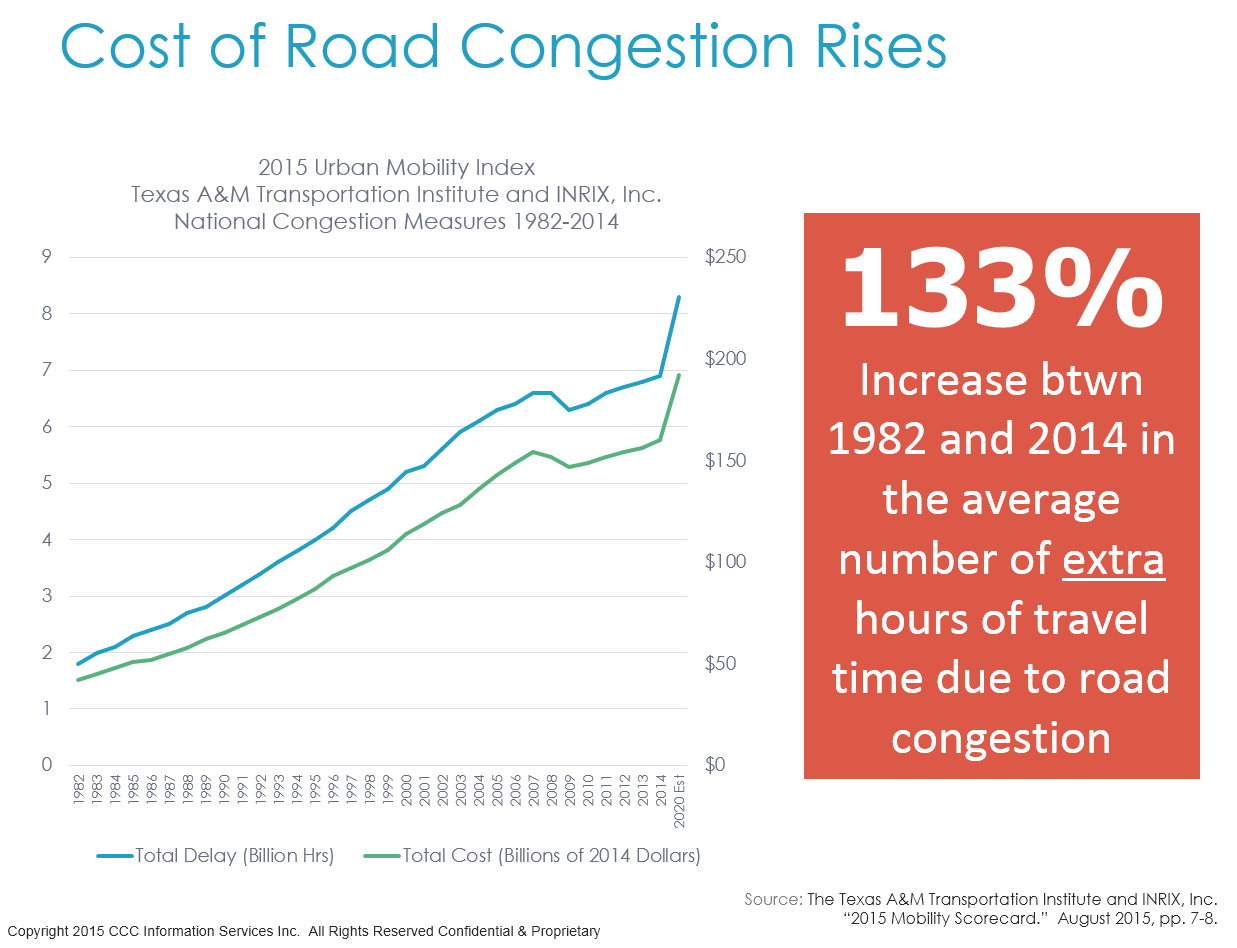
An August 2015 report “2015 Urban Mobility Scorecard,” released by the Texas A&M Transportation Institute and INRIX, projects that unless we see major economic issues, congestion on roadways in the U.S. will continue. By their estimation, there has been an increase of 133 percent between CY 1982 and CY 2014 in the average number of extra hours of travel time for the average road commuter due to road congestion (from 18 hours to 42 hours annually).
Adding to the congestion on at least 4,500 of the busiest highway miles in the U.S. are ten million or so trucks that moved more than 13 billion tons of freight across America’s highways in 2012 – a number expected to grow to 18.8 billion by 2040. In fact, per the “2015 Urban Mobility Scorecard,” trucks account for 18 percent of the ‘congestion cost’, while accounting for only 7 percent of urban travel.
One of the primary factors driving freight traffic is the growth rate of e-commerce: data from AlixPartners shows a 19 percent compound annual growth rate in e-commerce between 2000 and 2013, and a 45 percent increase in the average number of annual orders made online.
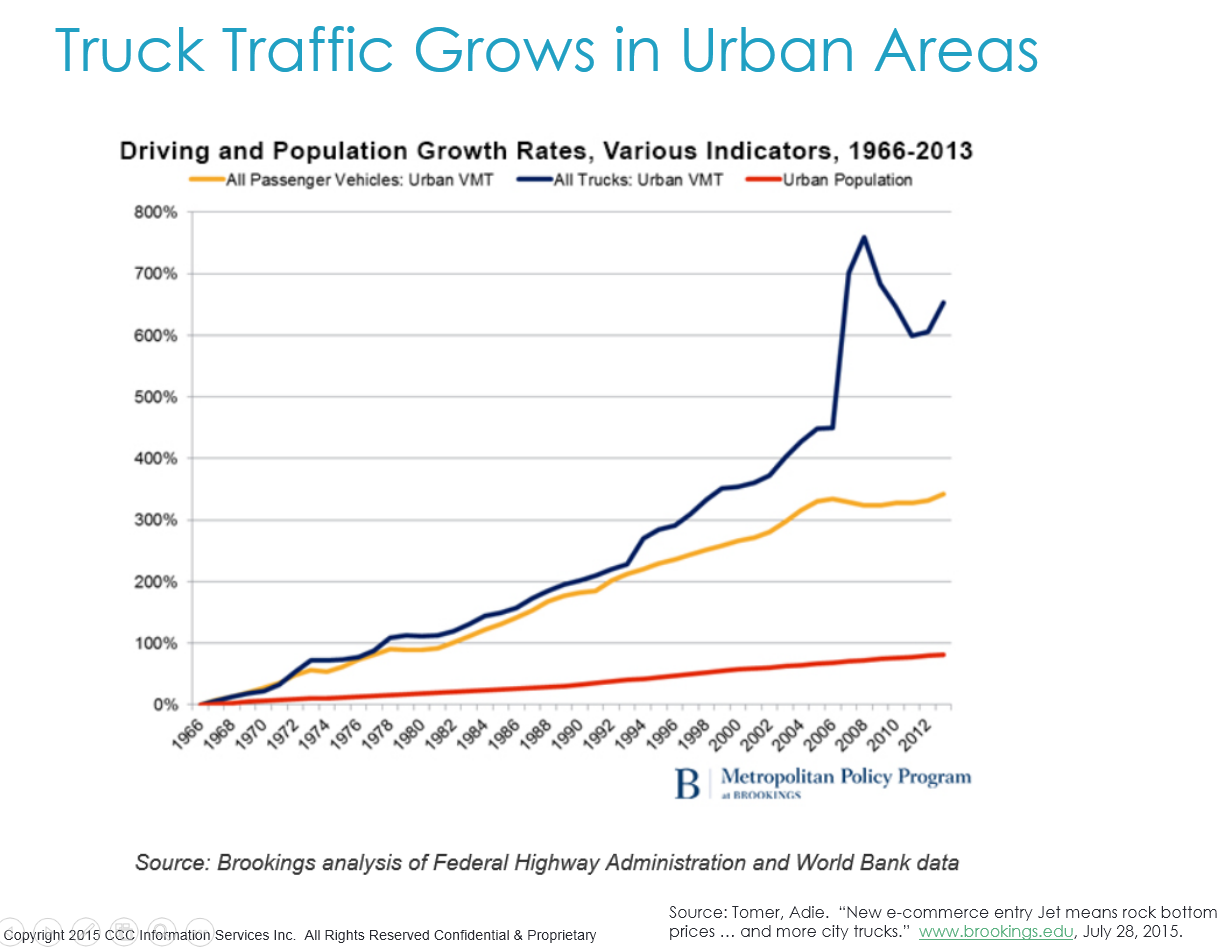
And while historically trucking has been predominantly concentrated on interstate highways, urban trucking experienced growth of nearly 800 percent between 1990 and 2008 before the Great Recession cut demand. As of 2012 however, the rate of urban miles traveled for trucks was back on the rise.
Despite data reported in “Large Truck and Bus Crash Facts 2013” revealing the number of large trucks involved in all types of accidents (fatal, injury, and property-damage only) fell overall between 2003 and 2013, there was an increase between 2012 and 2013. Passenger vehicle fatalities and crashes are up as well. Assuming the economy and employment continue to see steady growth, it is likely we will continue to see more vehicles on the road, and more miles driven overall.
But what can be done to help ensure motor vehicle accidents don’t grow further?
According to research from the National Highway Traffic Safety Administration (NHTSA), the human driver was the critical reason or last event in the crash causal chain for 94 percent (plus or minus 2 percent) of light vehicle crashes. Recognition error ranked as the most common reason among drivers (41 percent), followed by decision error (33 percent), performance error (11 percent) non-performance error (sleep, etc.) (7 percent), and other (8 percent). Only two percent of crashes were found due to vehicle failure or environment (slick roads, weather, etc.). Driver distraction, inattention and inadequate surveillance are among the key reasons that fall under “recognition error”. Use of cell phones for texting, talking, or even receiving a message have been found to add significantly to driver distraction, and driving in congested traffic tempts drivers even further to check their devices ‘just for a second’.
Much has been written regarding the advancements in vehicle crash avoidance, autonomous vehicles, and vehicle-to-vehicle communication. Numerous organizations have completed research underscoring the benefits and potential reductions in accident frequency and severity. But just how quickly can we expect these to begin countering other trends now driving accident frequency back up again?
The National Transportation Safety Board (NTSB) produced a special investigation report “The Use of Forward Collision Avoidance Systems to Prevent and Mitigate Rear-End Crashes” in May 2015 that concludes that collision warning systems, particularly when paired with active braking, could significantly reduce the frequency and severity of rear-end crashes. The report discusses the extensive research conducted by the Insurance Institute for Highway Safety (IIHS) and other organizations showing the range in performance of these systems in the market today, and calls on NHTSA to develop and apply performance standards for forward crash avoidance systems for both private passenger and commercial vehicles.
According to NTSB, 41.2 percent of new MY 2014 passenger vehicle models offered optional crash warning or crash avoidance systems; yet only 3.8 percent included either as a standard option. When measured based on the actual sales volume however, the number of vehicles equipped with the crash avoidance technology as standard equipment drops further as a share of the overall vehicle in use count for the 2014 MY vehicle.
The good news is that many more mainstream automakers are including these features in their 2015 and 2016 model year vehicles. For example, Volkswagen (VW) will offer adaptive cruise control, blind spot monitoring, and automated parking across its VW brand line-up for MY 2016 , and Toyota has pledged to adopt accident-avoidance features throughout its U.S. lineup by 2017. In fact, a recent update on the penetration of crash prevention systems in the U.S. vehicle fleet by the IIHS shows over fifty percent of all 2016 models have either crash prevention systems as standard or optional. Subsequently as the cost of these systems comes down, and consumer demand grows, the U.S. vehicle fleet will over time see the benefits of these systems through both fewer and less severe accidents.
Numerous analysts have projected new vehicle sales in the U.S. in 2015 will exceed 17 million, and analysts expect continued strong sales in 2016. This will grow the share of vehicles equipped with crash avoidance and crash warning, and potentially reduce accident frequency.
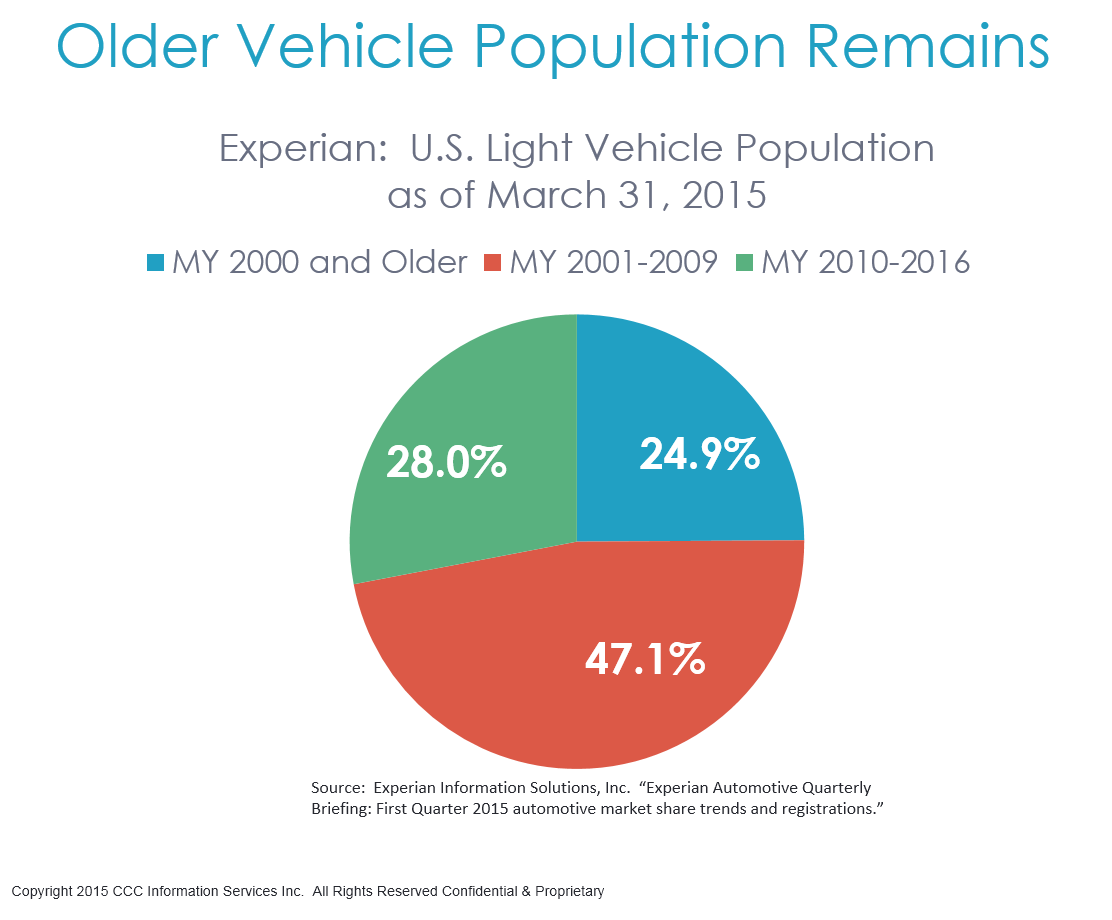
However, with 70 percent of vehicles on the road in the U.S. aged 7-years plus (25 percent of which are 15-years plus) , these newer vehicles will be driving alongside other vehicles with none of these crash avoidance or warning systems. Ninety percent penetration of any new vehicle safety technology has historically taken up to 30 years according to IIHS.
So what can be done in the meantime?
With drivers still in control of the vast majority of vehicles on the road in the U.S., that seems like the best place to start. Education programs such as those sponsored by IIHS, NHTSA and NSC help make consumers aware of the risks of distracted driving. And as data captured from usage based insurance (UBI) programs and telematics devices help provide better clarity into accident causation, consumers can literally see financial impacts by consciously changing their driving behavior. For example, data released by Progressive’s analysis of their Snapshot UBI program data found hard-braking was one of the most highly predictive variables for predicting future crashes. Learning to use more distance to stop seems like a good place to start.
Ensuring the drivers of the growing numbers of trucks on the road in the U.S. are safe is another. In the editorial mentioned at the start of this article, the author, a former executive at the American Trucking Associations from 1998 to 2014, takes issue with recent efforts by Congress to roll back safety improvements ordered by federal regulators. Specifically efforts that would i) allow drivers to work 82 hours a week, up from the current 70 hours over eight days; ii) eliminate the requirement that drivers take a two-day rest break each week; and iii) discourage the Federal Motor Carrier Safety Administration from investing in wireless technology that would improve monitoring of drivers and vehicles.
And lastly, what about moving some of this traffic to the skies with drone delivery help? Companies like Amazon and Google are looking to use drones to provide customers packages in 30 minutes or less. Insurers have great interest in drones’ ability to support underwriting, catastrophe response, and property damage evaluation. Enrique Iglesias might have a different opinion – while performing at a concert in Tijuana, Mexico, his efforts to grab a drone used to capture photos during his concert and give his audience a ‘Point of View’ shot resulted in pretty serious cuts to his hands. And with nearly quadruple the number of pilot encounters with drones so far this year, there’s clearly a need for better regulation of their uses.
In summary, economic growth has resulted in a ‘back-to-the-future’ environment, where miles driven, accident frequency, and road fatalities have returned or exceeded levels last seen in 2007. Greater road congestion due to growth in urban and suburban areas, more freight traffic, and more vehicles on the road overall however have led to more complex mobility on U.S. roads than ever before. Subsequently, while crash avoidance technologies, and growth in telecommuting and other non-vehicle commuting methods such as walking or biking will eventually help counter accident frequency growth, all signs point to further lifts in auto claim frequency in the near future.
Download this article
Fill out the form below to download this report now!
Sources:
1 “Traffic deaths jump 14% in 2015.” www.money.cnn.com, August 17, 2015.
2 Ibid.
3 NHTSA 2013 Traffic Safety Facts; NSC Motor Vehicle Fatality Estimates, May 2015.
4 FRED® Moving 12-Month Total Vehicle Miles Traveled, www.research.stlouisfed.org.
5 US DOT FHWA Office of Highway Policy Information Travel Monitoring. http://www.fhwa.dot.gov/policyinformation/hpms.cfm.
6 Ibid.
7 Ibid.
8 National Highway Traffic Safety Administration. “Traffic Safety Facts 2013: Rural/Urban Comparison.” July 2015.
9 Ibid.
10 U.S. DOT “Beyond Traffic 2045: Trends and Choices.” www.dot.gov/beyondtraffic, pp 24-25.
11 Ibid.
12 Sivak, Michael. “Commuting to Work in the 30 Largest U.S. Cities.” UMTRI-2015-17, May 2015.
13 Ibid.
14 Ibid.
15 U.S. Census Bureau. “Home-Based Workers in the United States: 2010.”
16 McKenzie, Brian. “Modes Less Traveled-Bicycling and Walking to Work in the United States: 2008-2012.” United Census Bureau, American Community Survey Reports, Issued May 2014. ACS-25.
17 McKenzie, Brian. Who Drives to Work? Commuting by Automobile in the United States, 2013. Released August 2015 ACS-32.
18 The Texas A&M Transportation Institute and INRIX, Inc. “2015 Mobility Scorecard.” August 2015, pp. 7-8.
19 Ibid.
20 US DOT “Beyond Traffic 2045: Trends and Choices.” www.dot.gov/beyondtraffic, p 53.
21 The Texas A&M Transportation Institute and INRIX, Inc. “2015 Mobility Scorecard.” August 2015, p14.
22 http://fleetowner.com/fleet-management/free-yet-faster-becoming-key-e-commerce-shipping-demand.
23 Tomer, Adie. “New e-commerce entry Jet means rock-bottom prices… and more city trucks.” www.brookings.edu, July 28, 2015.
24 U.S. Department of Transportation, Federal Motor Carrier Safety Administration. “Large Truck and Bus Crash Facts 2013.” April 2015.
25 Ibid.
26 U.S. Department of Transportation, National Highway Traffic Safety Administration. “Traffic Safety Facts: Crash Stats.” DOT HS 812 115, February 2015.
27 Ibid.
28 Ibid.
29 Study from Florida State University found that just receiving a notification (be it ringtone, buzz, or other) on a cell phone while driving caused similar levels of distraction to when calling or texting. Source: “Cell Phone Alerts Impair Focus Even When Calls Not Answered.” www.carriermanagement.com, July 19, 2015.
30 National Traffic Safety Board. “The Use of Forward Collision Avoidance Systems to Prevent and Mitigate Rear-End Crashes.” May 2015.
31 Ibid, p. 37.
32 Ibid, p. 32.
33 http://www.autonews.com/article/20150729/OEM06/150729841/vw-rolls-out-crash-avoidance-with-16-lineup.
34 http://www.autonews.com/article/20140908/OEM06/309089966/toyota-to-add-active-safety-tech-to-entire-u-s-lineup-by-2017.
35 Insurance Institute for Highway Safety/Highway Loss Data Institute. “Status Report: Stopping Power. IIHS rates 19 new models for front crash prevention.” Vol. 50, No. 7. August 26, 2015.
36 Analyst estimates from TrueCar, LMC, KBB, and others.
37 Data as of March 31, 2015 (U.S. light duty vehicles only). Experian Information Solutions, Inc. “Experian Automotive Quarterly Briefing: First Quarter 2015 automotive market share trends and registrations.” Slide 7.
38 Insurance Institute for Highway Safety. “Status Report: Estimated Time of Arrival.” Vol. 47, No. 1, Jan 24, 2012, p. satellite photos 3.
39 “Hard Braking Most Likely Predictor of Future Crashes: Progressive.” Claims Journal, May 19, 2015. http://www.claimsjournal.com/news/national/2015/05/19/263424.htm.
40 Abramson, Howard. “The Trucks Are Killing Us.” The New York Times, Op-Ed, Saturday August 22, 2015, A17.
41 Brewer, Jeffrey. “FAA Complexity, but opportunity with drones.” www.propertycasualty360.com, Jun 26, 2015.
42 Heller, Corinne. “Enrique Iglesias Suffers Bloody Injury in Drone Accident at Tijuana, Mexico Concert.” www.eonline.com, Mon., Jun 1, 2015