
This article was originally featured in Property Casualty 360.
An article released earlier this year began a discussion of several broad demographic changes that continue to drive change within the automotive claims and collision repair industries. Demographics of age and race were explored previously; here we will explore further demographic shifts in terms of where people are choosing to live and how that may be driving auto claim frequency trends.
Where are People Living?
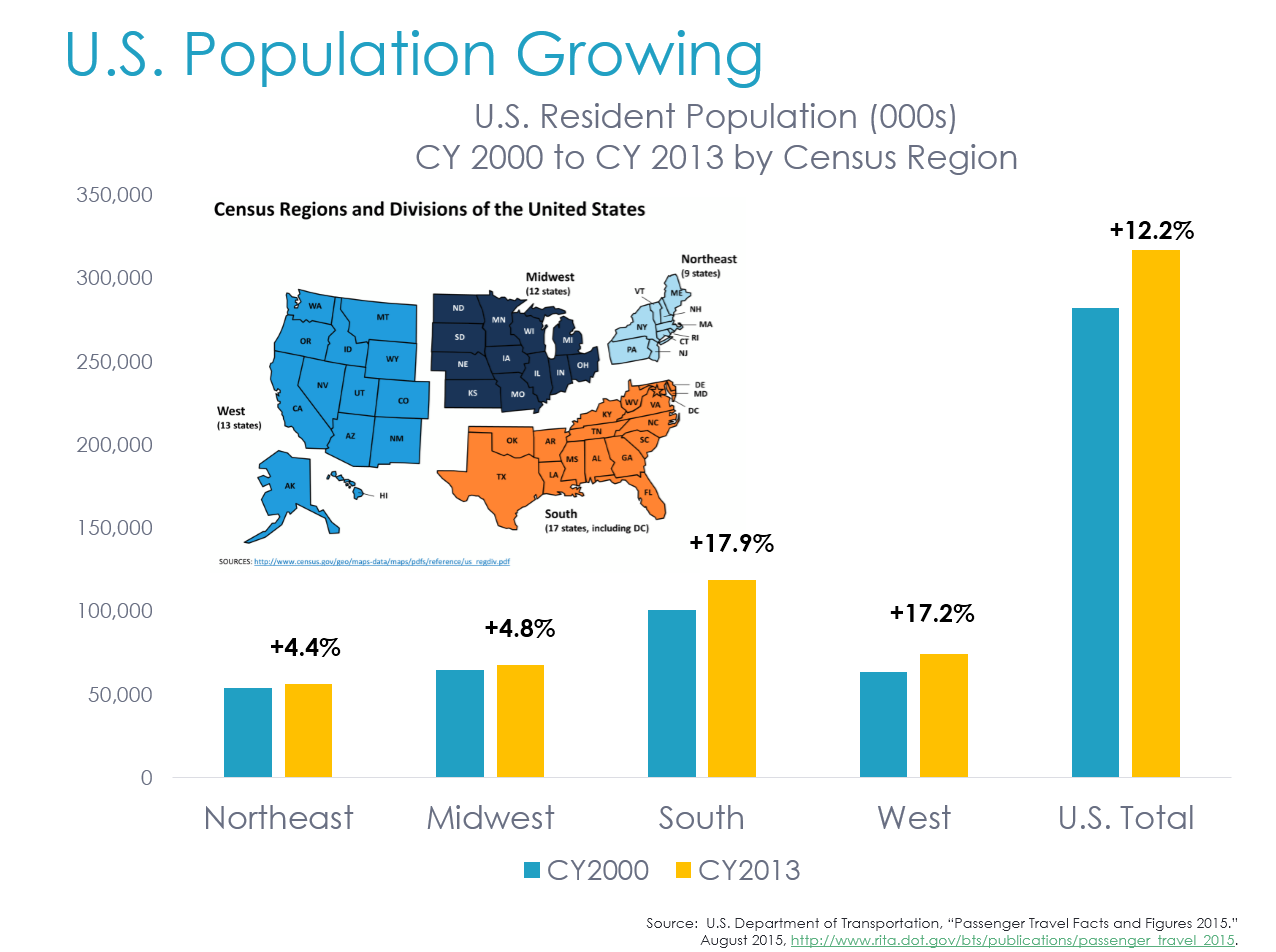
Data from the U.S. Department of Transportation shows the U.S. population grew by 12.2 percent, from 282.2 million residents to 316 million between CY2000 and CY2013.1 Among the four primary census regions, resident population grew most in the South, followed by the West regions, and much slower growth occurred in the Northeast and Midwest regions.2
Data from the U.S. Department of Transportation reveals the U.S. population has become increasingly urban, with the most growth occurring in the suburban areas.3 In fact, three quarters of all population growth since 1980 has occurred in the suburbs.4 And even while the annual population growth rate of large cities in the U.S. between 2010 and 2013 was double what it had been in the previous decade, outpacing the growth rate in suburbs, approximately 50 percent of all Americans still live in the suburbs.5
Analysis of recent census data through July 2014 by William Frey of the Brookings Institute confirms populations in the U.S. large cities has continued to grow, but the rate of growth slowed in most recent years.6 In fact, 7 of the 10 largest U.S. cities experienced slower growth rates in 2013-2014 than in 2012-2013.7 Among the fastest growing cities of 250K or more residents now appear to be in Texas (Austin and Fort Worth), the Southeast (Orlando, FL and Durham, NC), and the Mountain West (Henderson, NV and Denver, CO).8
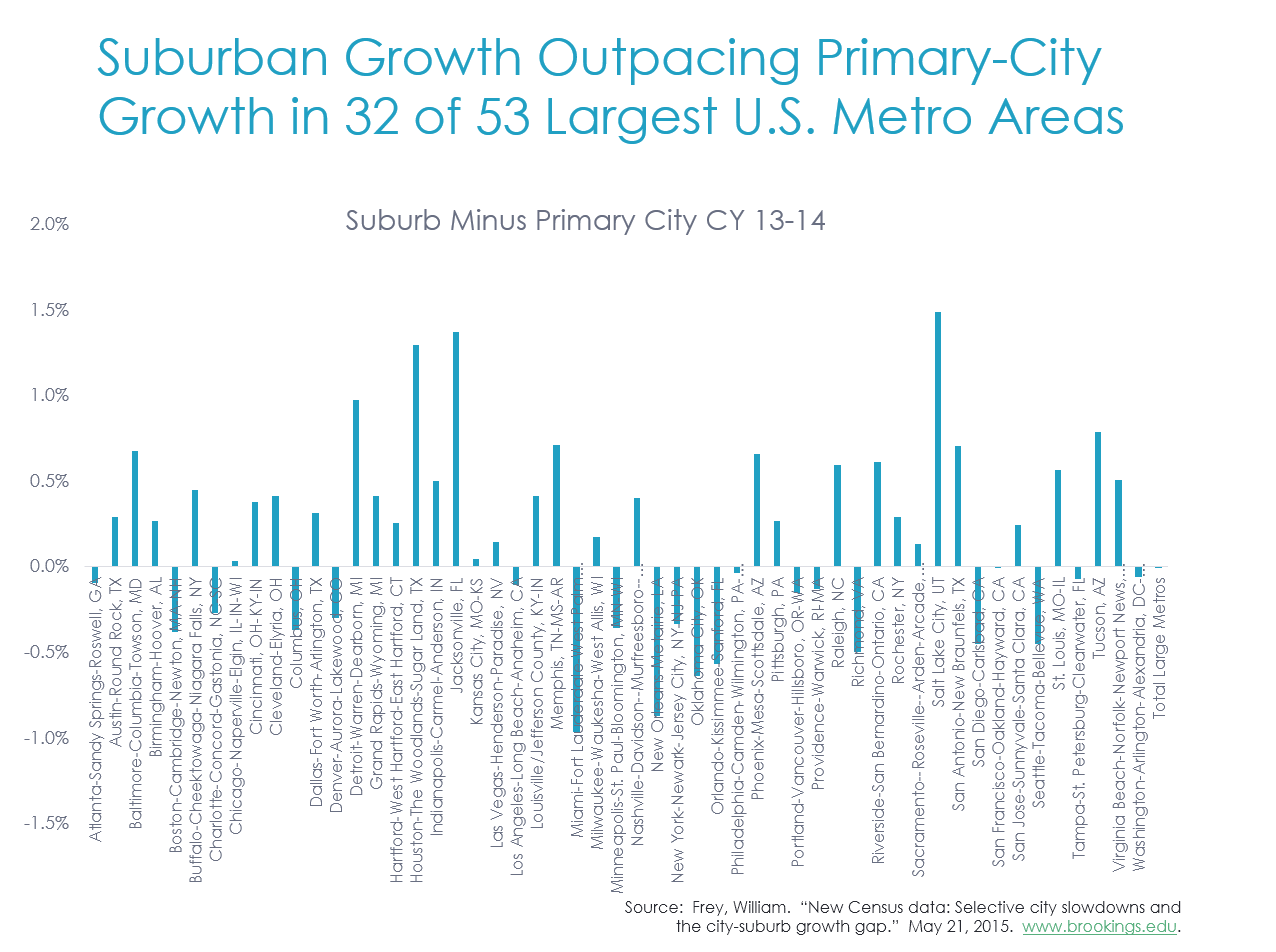
Of special note is that in 32 of the 53 large metro areas in the U.S. (with population exceeding 250K) there has been stronger growth in suburban growth than in primary-city growth between CY 2013 and 2014.9 With suburban residents typically relying on their vehicles to commute to work and other places, this is yet another factor adding to increased road congestion in the U.S.
More People, More Miles
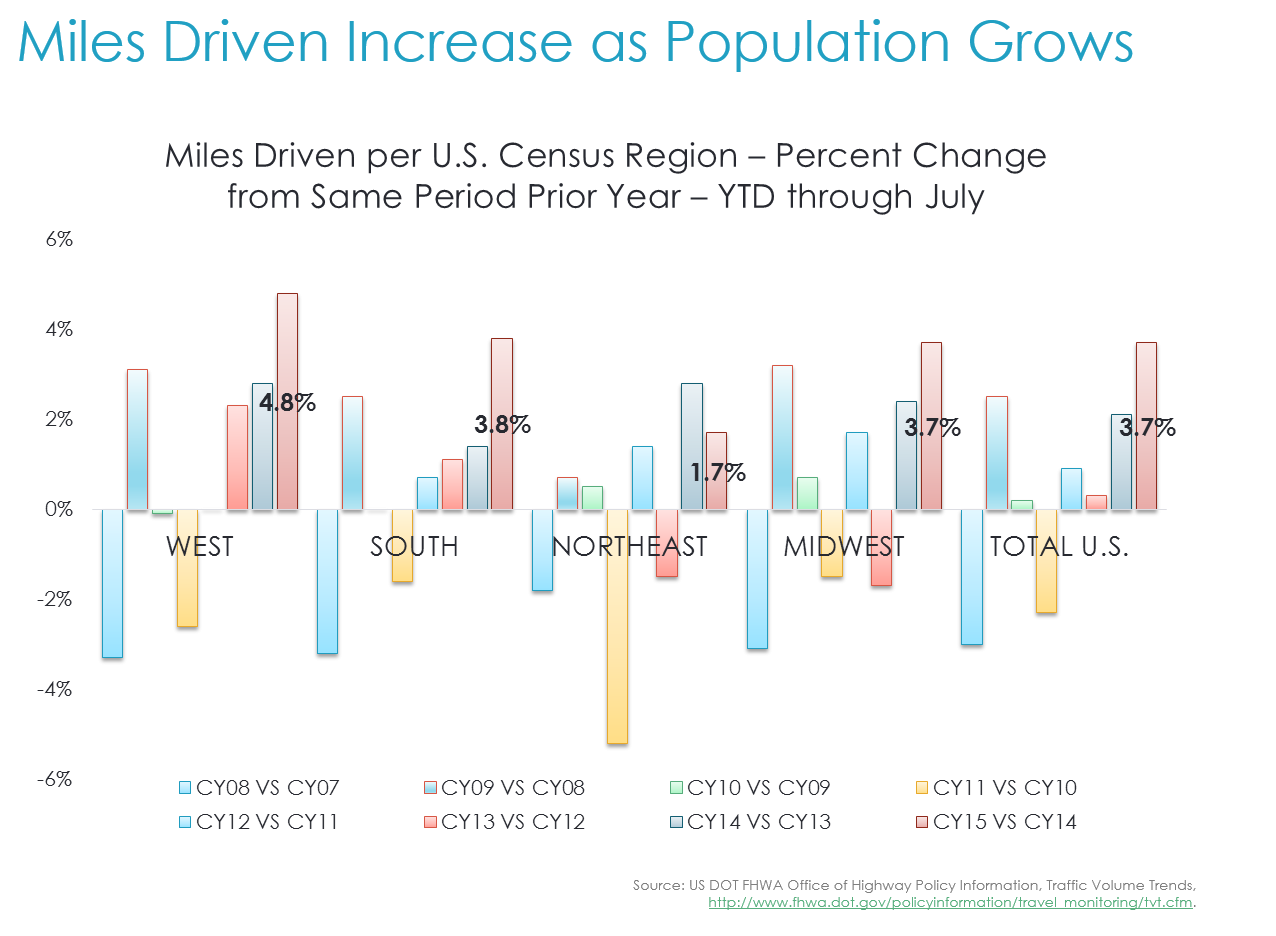
Nationally, the U.S. has seen steady growth in the overall number of miles driven. After peaking pre-recession, then declining and growing only moderately during and after the recession, miles driven have experienced some of their largest increases so far in 2015. For the rolling 12 month period ended July 2015, miles driven in the U.S. are now up 2.1 percent above the prior peak for the 12 months ended November 2007, and miles driven this year through July nationally are up nearly 4 percent versus 2014 through July.10
When broken out by census region, the largest increases in overall miles driven are in the West and South where resident population has also seen more growth.11
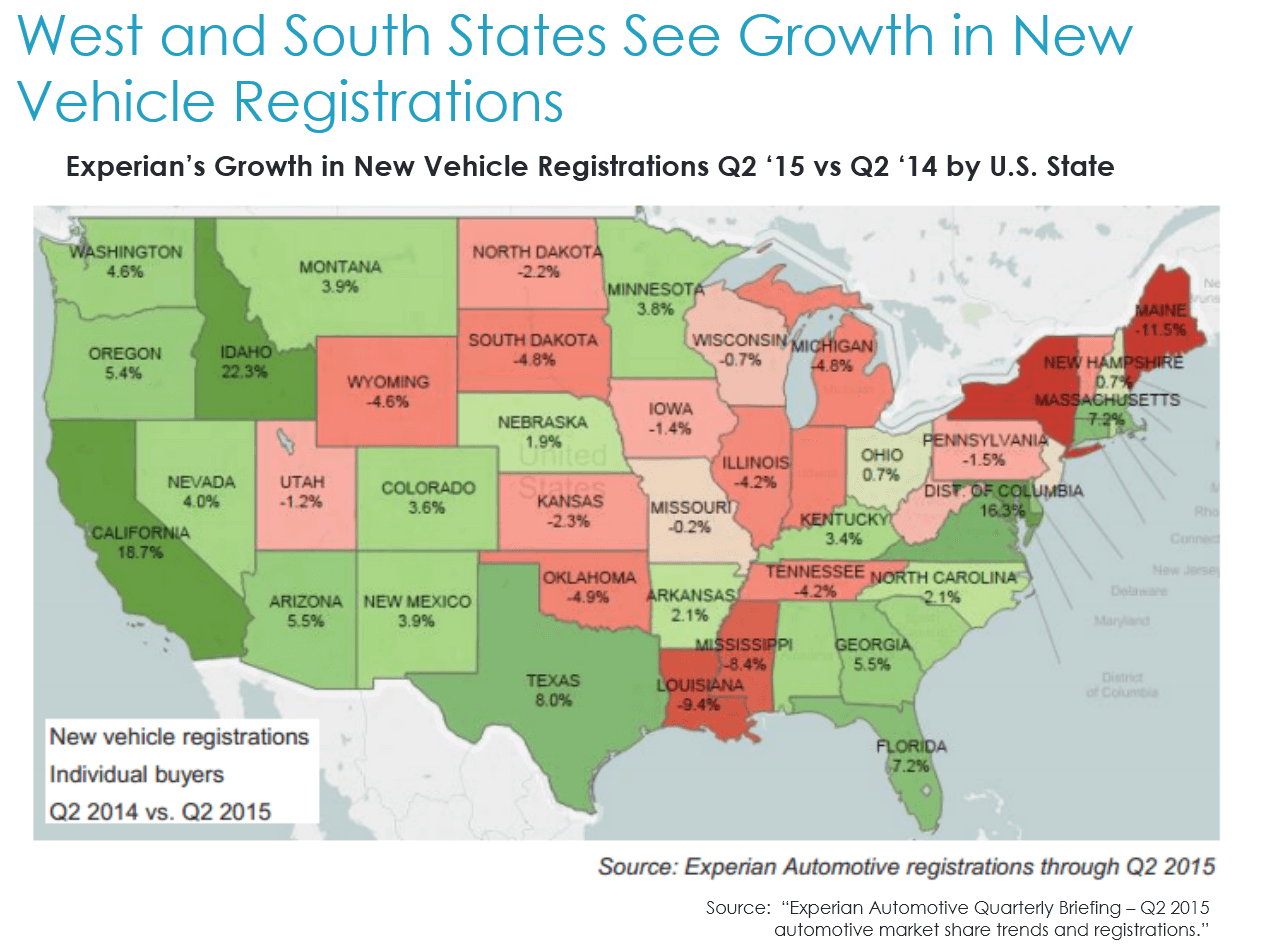
Also worth noting is the growth in new vehicle registrations by individual state. In their Q2 2015 market trends update, Experian provided a state-by-state update on growth in new vehicle registrations to individual buyers versus the same period prior-year.12 States with some of the largest increases also were located in the West and South Census regions – with Idaho and California leading the pack.13
As the U.S. population shifts to the South and West census regions, total miles driven and vehicle registrations appear to also be growing. If auto claim frequency is a by-product not only of more drivers and vehicles on the road, but more miles driven, or ‘exposure’, then it seems logical that we might expect that claim frequency would be seeing similar shifts by geography.
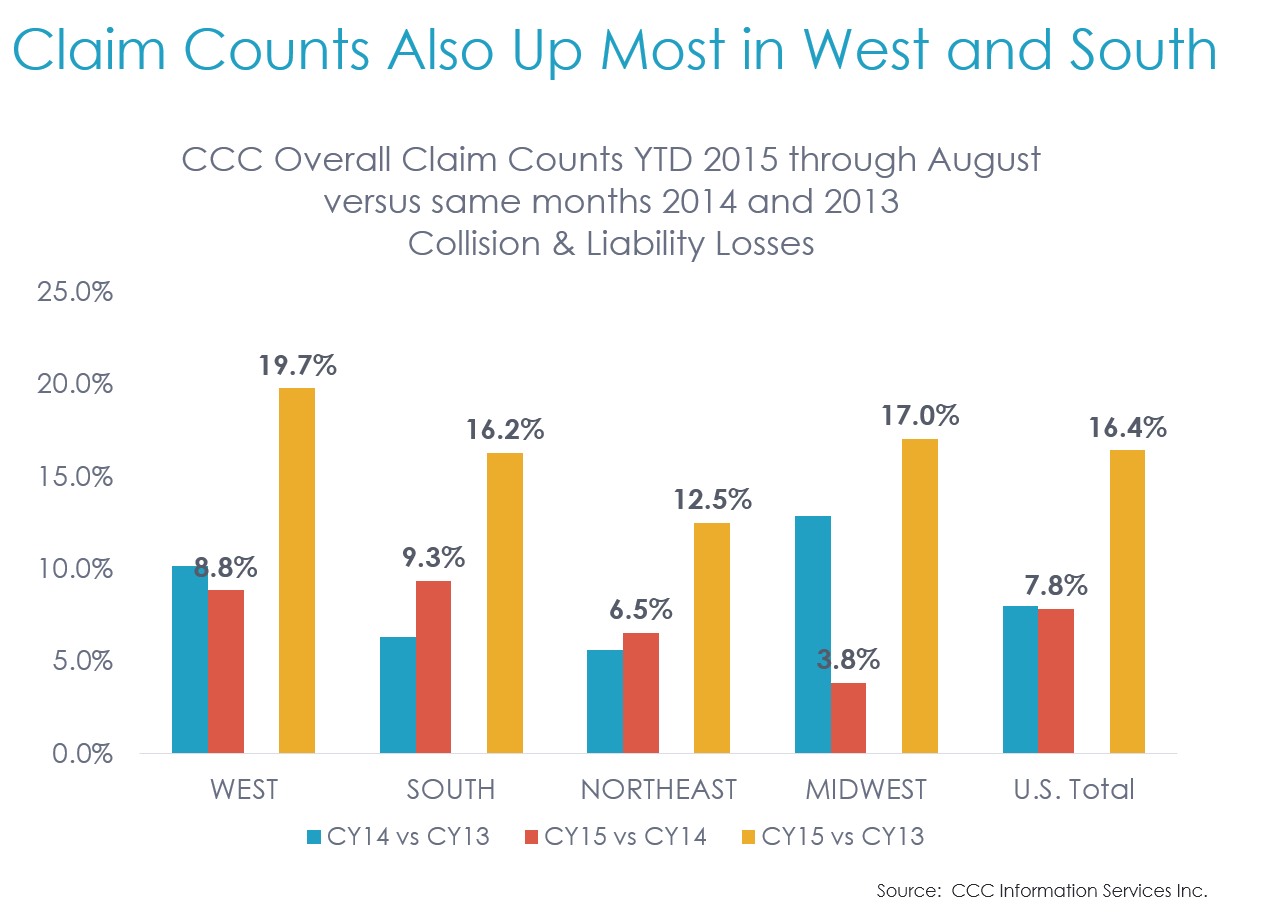
A comparison of overall collision and liability claim counts (includes repairable and total loss claims) year-to-date through August of this year reflect a similar split geographically. The states that experienced the largest increases in claim counts included those that fall in the West and South census regions, with smaller increases in the Midwest and Northeast census regions.
Summary
The U.S. population continues to shift to the West and the South census regions, with the most growth within suburban areas. With growth not only in miles driven, but also in registered vehicle counts and resident population, perhaps it should come as no surprise that these areas are also experiencing faster claim frequency growth. As the demographics of the U.S. continue to shift not only in terms of age, gender, race, but also in terms of location, we can expect to see an impact within auto claim frequency data as well.
Download this article
Fill out the form below to download this report now!
Sources:
1 U.S. Department of Transportation, “Passenger Travel Facts and Figures 2015.” August 2015, http://www.rita.dot.gov/bts/publications/passenger_travel_2015.
2 Ibid.
3 U.S. DOT “Beyond Traffic 2045: Trends and Choices.”www.dot.gov/beyondtraffic, pp 24-25.
4 Ibid.
5 Ibid.
6 Frey, William. “New Census Data: Selective city slowdowns and the city-suburb growth gap.” May 21, 2015. www.brookings.edu.
7 Ibid.
8 Ibid.
9 Ibid.
10 U.S. DOT FHWA Office of Highway Policy Information, Traffic Volume Trends, http://www.fhwa.dot.gov/policyinformation/travel_monitoring/tvt.cfm.
11 Ibid.
12 “Experian Automotive Quarterly Briefing – Q2 2015 automotive market share trends and registrations.”
13 Ibid.