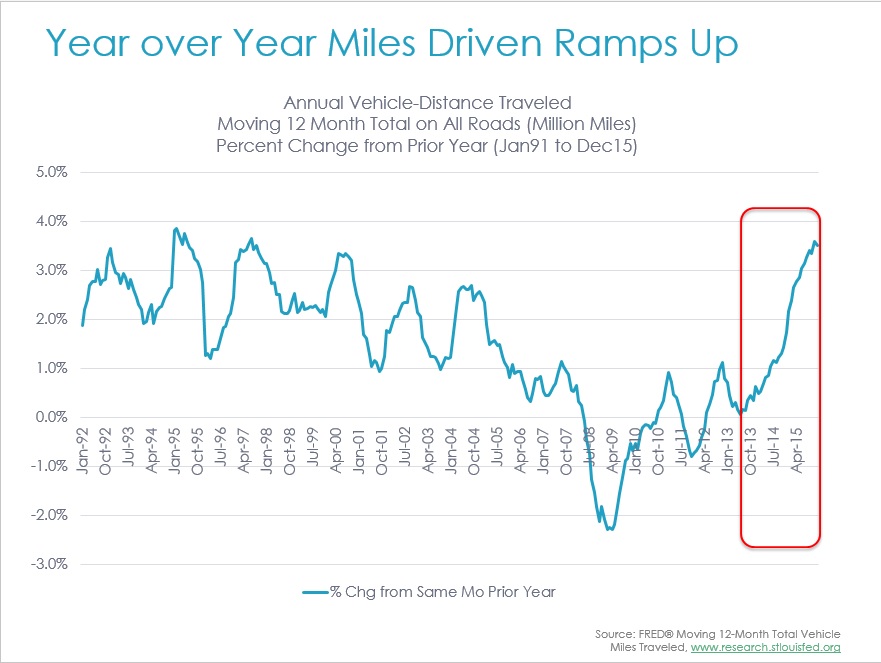
Increases in auto claim frequency have been a topic of great interest to all in our industry. Miles driven in the U.S. had been trending up slowly coming out of the recession, but when gas prices dropped, miles driven began to increase again.
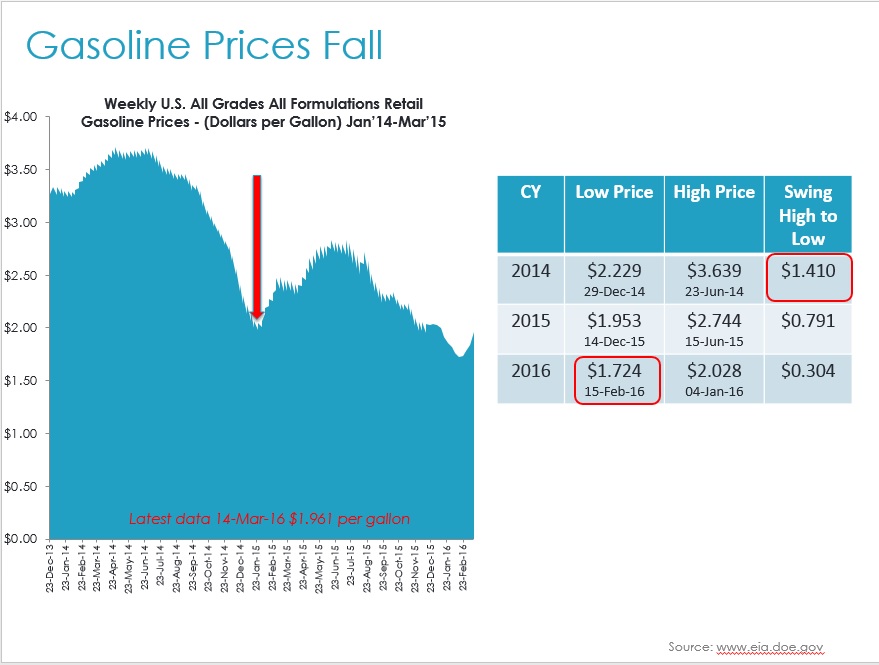
Overall miles driven rose 3.5% in CY 15 versus the prior year, but the increases really began when gas prices fell in Q4 2014.
Many studies have been published that examine the correlation of miles driven to gasoline prices.1 The premise is that people drive more, and at faster rates, when gas prices are lower; and people are also less likely to use public transportation.
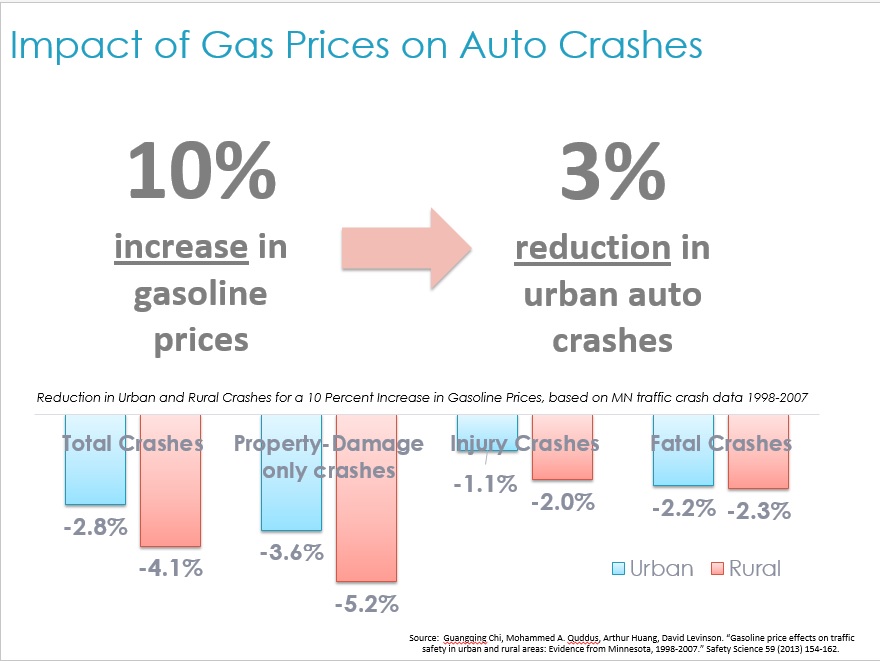
One particular study published in 2013 used traffic crash data from 1998 to 2007 at the county level in Minnesota and found that gasoline price effects on total crashes, property-damage-only crashes, and injury crashes are stronger in rural areas than urban areas.2 Overall their results pointed to a drop of 3 percent in urban crashes when gas prices increase by 10 percent. And while the study does not specifically look at what happens when gas prices drop by 10 percent, one might infer that crash rates would rise.
Additionally, other studies have been completed that look at the short term effects of gasoline prices on traffic crashes, which were found to be generally stronger than the delayed effects.3 In other words, when gas prices are cheaper, people generally begin to drive more right away, but over the long term those increases tend to flatten out.
So, have we seen as much of a lift in miles driven as can be expected? Is it possible that frequency will see only moderate increases over the next several years as long as we see no major economic slowdown or widespread severe winter weather like in 2014?
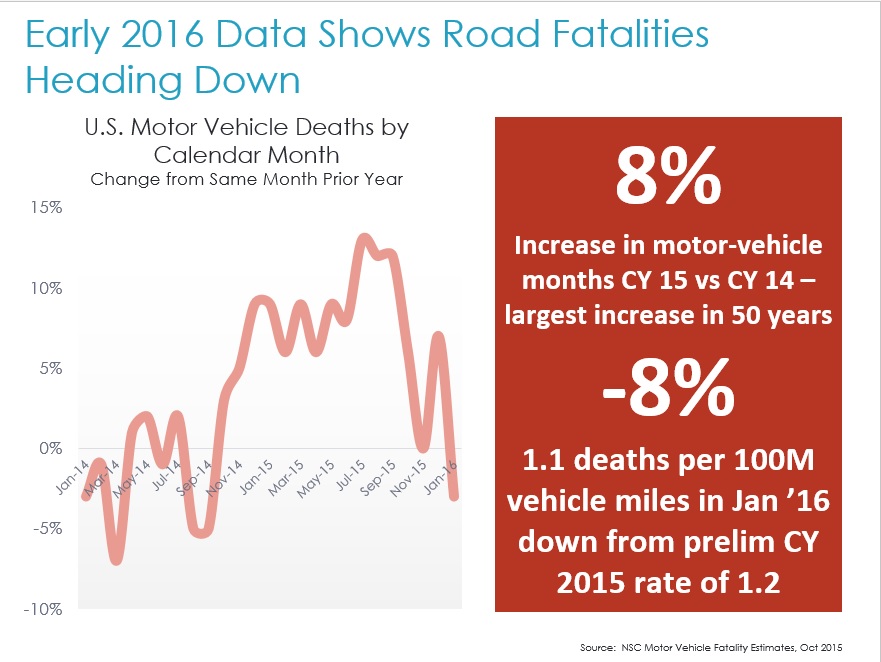
Road fatality numbers from the National Safety Council for January 2016 trended down for the first time in many months, and the fatality rate per 100M miles driven fell to 1.1 – an 8 percent decline from the preliminary full year rate of 1.2 for CY 2015. If this is the beginning of a trend, it’s obviously a good one.
So what can we expect for frequency heading into the spring and summer months of 2016?
The U.S. Energy Information Administration’s Short Term Energy Outlook for 2016 projects gas prices will remain below $3 per gallon through 2017, despite recent return to a $40 per barrel oil price and discussion among OPEC countries and non-OPEC countries to stabilize production.
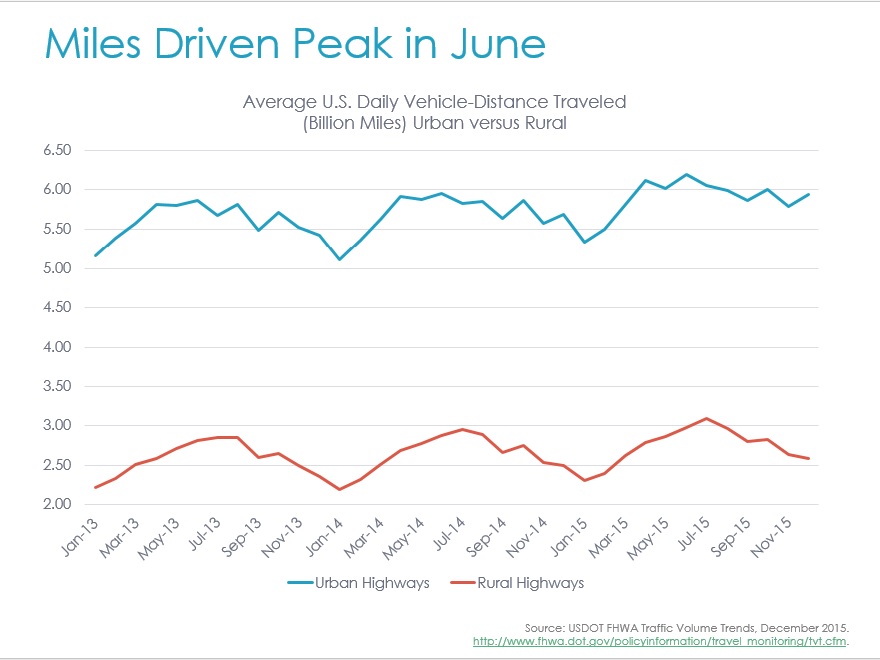
And despite the typical seasonal lift in gas prices that occurs in the summer months, consumers are expected to hit the road in large numbers. According to AAA, over 100M travelers hit the road over the 2015 year-end holiday season, with more than 90 percent of them driving to their destinations. And, historically the average daily vehicle-distance traveled in the U.S. has peaked each year in June.4
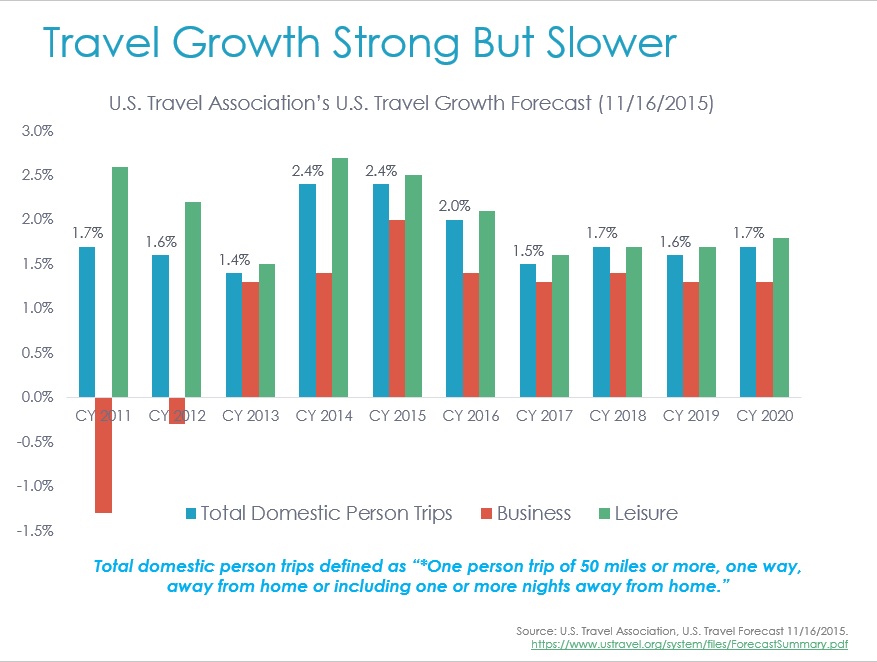
And while the U.S. Travel Association forecasts an increase in ‘total domestic person trips’ in CY 2016, the forecasted growth is slightly less than in the last two years.5
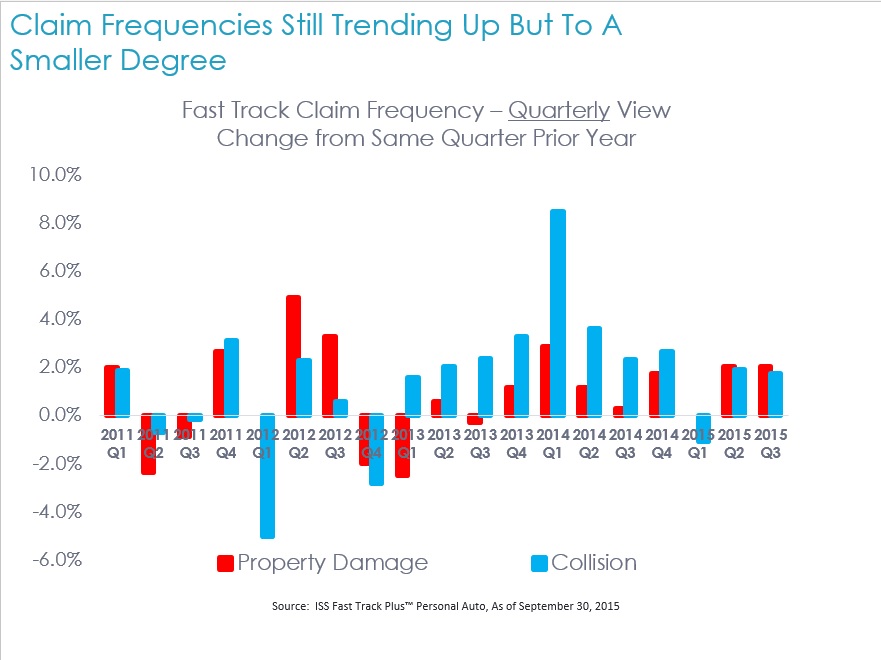
In Q2 and Q3 of 2015, claim frequency for collision and property damage rose about 2 percent from the same periods in 2014.6 Given the continued growth in claim counts as seen by CCC during the first several months of the year, a similar increase in frequency in Q2 and Q3 2016 seem likely.
With more vehicles on the road, and moderate growth in the miles per vehicle, overall ‘exposure’ rates are still elevated to pre-recession levels.
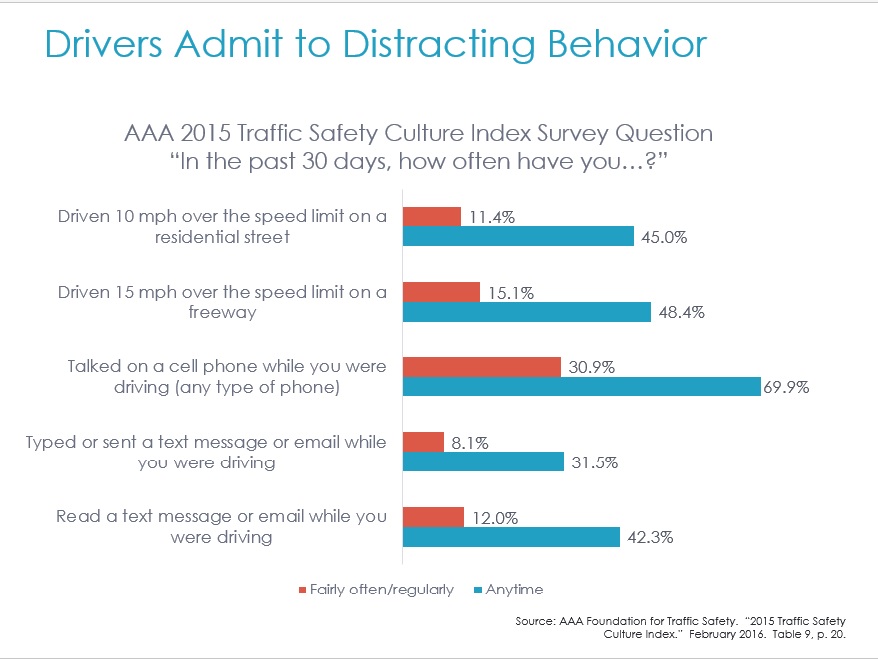
Combine this distracted driving, and accident counts are unlikely to see any significant fall in the near future. With nearly 50 percent of drivers admitting to “read a text message or email while you were driving”, consumers are increasingly taking risks behind the wheel.7
And while many of the technologies that support fully autonomous driving are already showing up in today’s vehicles, in the near term the driver is still in charge. As more vehicles offer things like Wi-Fi and connected services, driver distraction will grow further.
In fact, barring any major economic slowdown, and depending on continued growth in registered vehicles in the U.S., we can expect claim frequency to experience further moderate increases over the next several years, until market penetration of collision avoidance systems and potentially even early generation autonomous vehicles help to drive down claim frequency in a meaningful manner beginning in 2020.8
[1] (e.g. Kopits and Cropper, 2005; Scuffham, 2003; Sivak and Schoettle, 2010; Traynore, 2008, 2009). Guangqing Chi, Mohammed A. Quddus, Arthur Huang, David Levinson. “Gasoline price effects on traffic safety in urban and rural areas: Evidence from Minnesota, 1998-2007.” Safety Science 59 (2013) 154-162.
[2] Ibid.
[3] Ibid.
[4] USDOT FHWA Traffic Volume Trends, December 2015. http://www.fhwa.dot.gov/policyinformation/travel_monitoring/tvt.cfm.
[5] U.S. Travel Association, U.S. Travel Forecast 11/16/2015.
[6] ISS Fast Track Plus™ Personal Auto, As of September 30, 2015.
[7] AAA Foundation for Traffic Safety. “2015 Traffic Safety Culture Index.” February 2016. Table 9, p. 20.
[8] CCC Intelligent Solutions