
(This article first appeared in Property Casualty 360.)
In Crash Course 2016, we explored the impact of a changing vehicle fleet on vehicle repair and total loss costs. In this article we’ll look at some of the most recent data on vehicles being sold and driven in the U.S. and how that is driving costs within the automotive claims and collision repair industries.
Consumer Preference Drives Change in New and Used Vehicle Sales
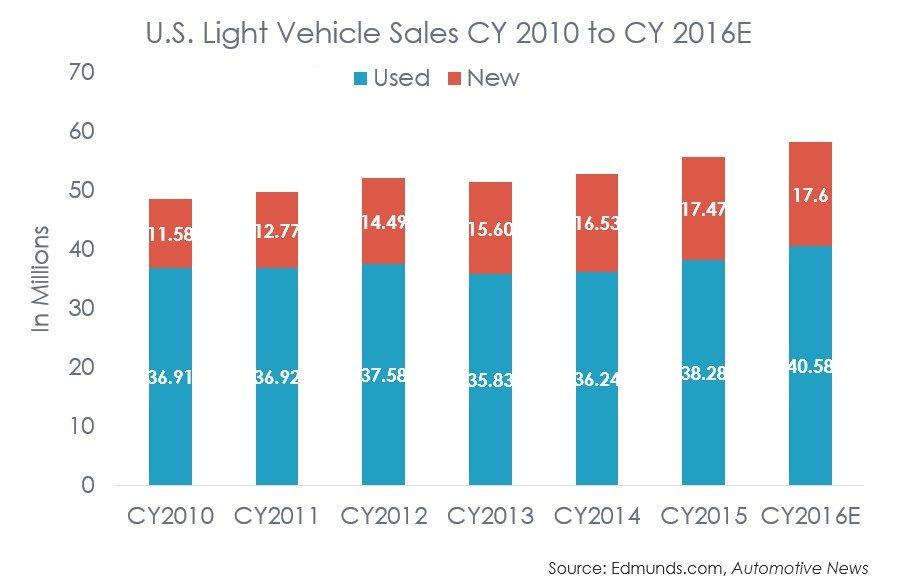
Both new and used vehicle sales in the U.S. saw large gains in 2015, and are seeing further growth in 2016. CY2015 was a banner year for automakers where virtually all (with the exception of VW) saw new vehicle sales increase – something that has happened only one other time in the last 20 years (1999).1
Analysts have projected new sales will reach 17.6 million in 2016, and with used retail unit volumes up 6.5 percent in Q1 2016, used sales will also exceed prior year sales.2 According to Manheim, the seven publicly traded dealership groups reported their 27th consecutive quarterly increase in same-store used retail unit volumes.3
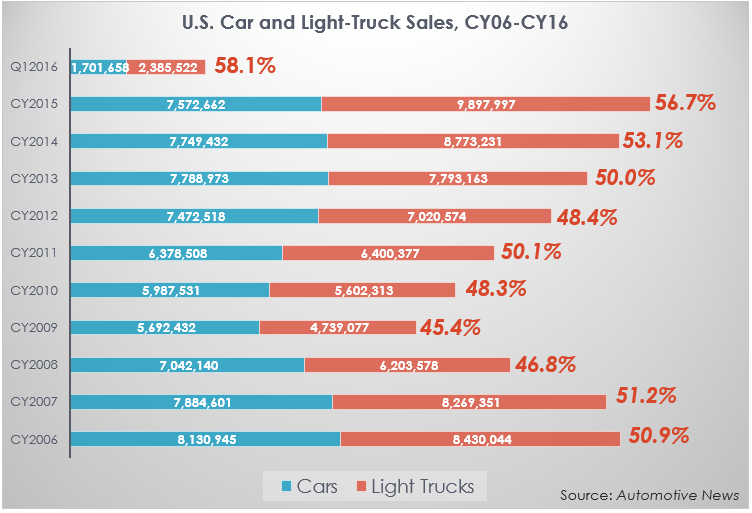
Whether it is low gas prices, or preference for vehicles that offer more flexibility and higher sight lines than cars, analysts believe the consumer shift to crossovers is likely here to stay.5
Strong truck sales have helped push the average new vehicle transaction price to over $33K.6 Consumers are financing these purchases by extending the length of their loan terms, or signing up for more leases.
With more new vehicles being added into the vehicle fleet, IHS Automotive reports the increase in the average age of vehicles on the road in the U.S. is returning to a rate consistent with pre-recession levels.7 Between CY2002 and CY2007, the average age of vehicles on the road in the U.S. grew about 3 percent; during CY2007 to CY2014 however the average age went up about 15 percent.8 And over the next five years, CY2016-CY2020, the average age is expected to increase about 3 percent annually.9
Leases as a share of retail sales in 2015 reached nearly 30 percent, and continue to account for a growing share of the overall unit growth for retail sales. In fact, in 2012, leases accounted for 28 percent of all new vehicle retail growth; by 2015 it had jumped to 67 percent.10 As of Q1 2016, over $1 trillion in open balances of auto loans and leases. The overall value of open leases grew by 27.6 percent in Q1 2016 versus the same period prior year to $76.9 billion; with growth in the volume of both vehicle loans and leases to the prime, non-prime and subprime sectors of 8.9 percent, 9.5 percent and 10.9 percent respectively.11
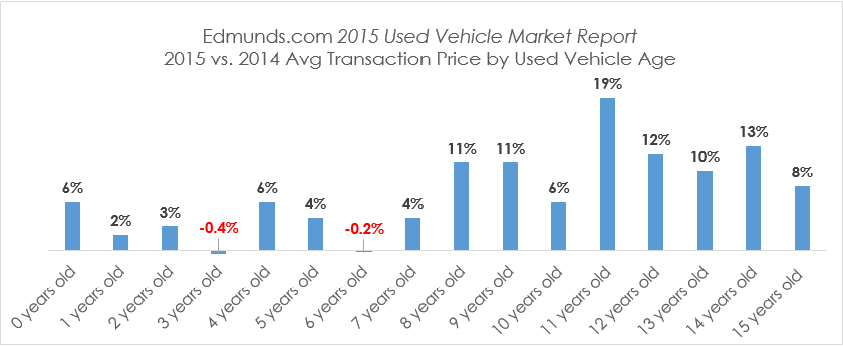
Evidence of the growing supply of returned lease vehicles beginning to drive down pricing can be seen in the change in average transaction price of 3- and 6-year old used vehicles from 2014 to 2015 published in Edmunds.com’s 2015 Used Vehicle Market Report.
And while the year-over-year change in transaction price presented in the Edmunds.com report does not report any adjustments made to account for change in mix of vehicles within each age that might have occurred and subsequently driven more/less of the change in value, it illustrates the pressure on used vehicle prices where supply has improved.
With increased off-lease volume of two-year old and three-year old vehicles in particular returning to market, the average age of used vehicles retailed has begun to fall. According to Edmunds.com, the average age of a used vehicle sold has fallen to 4.5 years old in Q1 2016 from 4.6 years old in CY12, CY13, and CY14.12 This shift towards a newer used vehicle mix with more content has also helped drive the average used vehicle transaction price to $18,838 in Q1 2016.13 This influx of newer units however has also begun to put significant downward pressure on the pricing of slightly older, higher-mileage units.14
The used vehicle market is also experiencing a wide range of performance across the different vehicle categories. For example, NADA reports that on average wholesale used vehicle values for vehicles 8 years and newer are down nearly 2 percent in 2016 through April versus Q4 2015 prices; but all luxury vehicles experienced drops of 4 percent or more.15 Manheim’s Used Vehicle Value Index (where the mix of vehicles is also more heavily weighted to vehicles 8 years and younger)shows in April 2016 prices for compact cars fell over 8 percent versus April 2015, while pickups rose 6 percent, midsize cars fell 0.8 percent and prices overall were down 1.1 percent.16
Overall auto sales in the U.S. remain strong, and consumer demand has been shifting back to light trucks, driving change within the vehicle fleet and the retention value of vehicles. Increased supply of leased cars now hitting the market are meeting lower demand, and prices have begun to ease. What does that mean for automotive claim and collision repair costs?
Let’s find out…
Claims Mix Continues to See Growth in Newer Model Year Vehicles
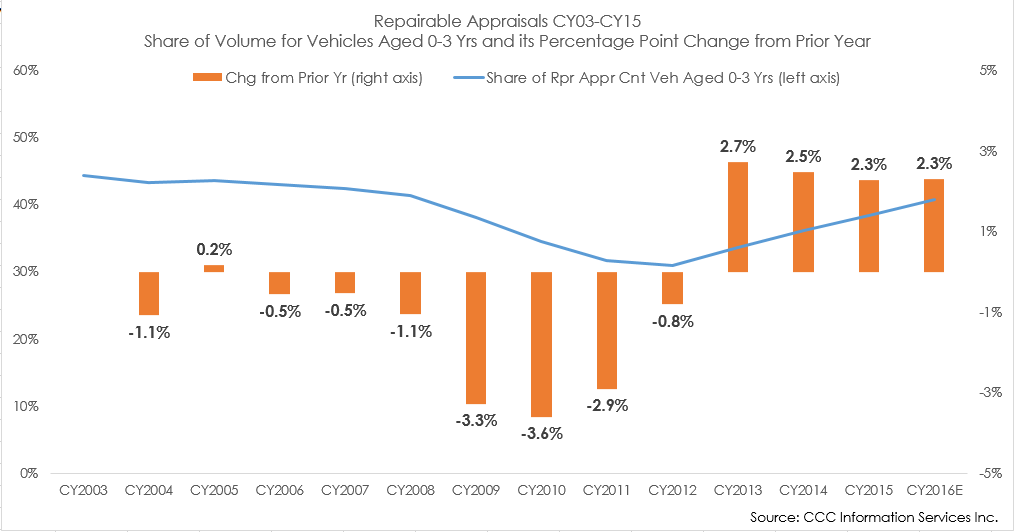
Repairable Vehicles Experience Further Shift in Vehicle Mix
During the recession, when new vehicle sales fell sharply, the average age of vehicles on the road in the U.S. aged faster. With new vehicle sales hitting new records, the industry is starting to see more of the younger vehicles within the claims mix although the growth rate has slowed. After several years of a 3 percent or more drop in volume share for the youngest vehicles (aged 0 to 3 years), the automotive claims industry is well into its fourth year of growth in these newer vehicles.
Repair costs began to increase again coming out of the recession. Severe winter weather in CY14 and CY15 in many parts of the U.S. led to increases in collision and liability losses, as more drivers were on the road and encountering icy or wet roads.
A comparison across vehicle age groups however reveals the largest increases occurred for the newer model year vehicles.
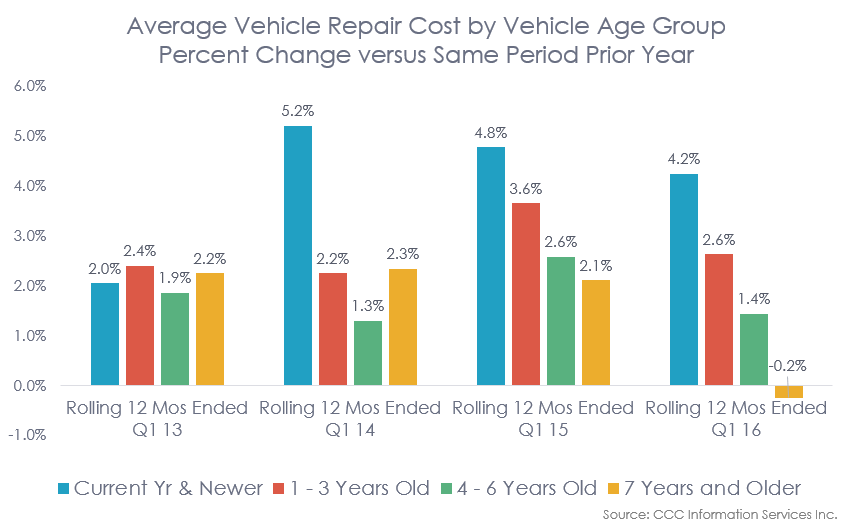
The year-over-year increase in repair costs for vehicles aged current year has grown fastest among the individual age groups, increasing the overall gap between the repair costs for the newest and oldest vehicles.
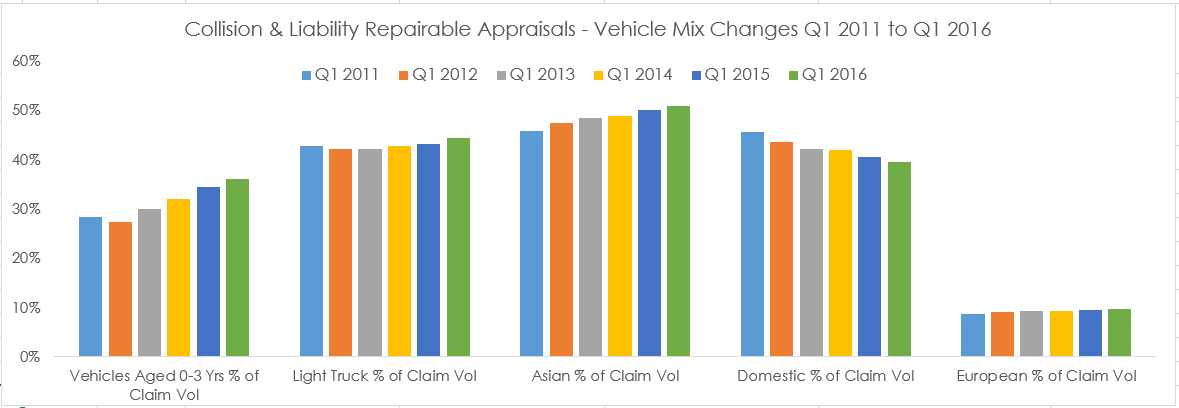
Changes in vehicle mix among the newer model year vehicles can in part explain some of this growing difference in repair costs. Overall the vehicle mix of appraisals continues to shift to vehicles that have historically had higher repair costs: newer vehicles, light trucks, and non-domestic vehicles.
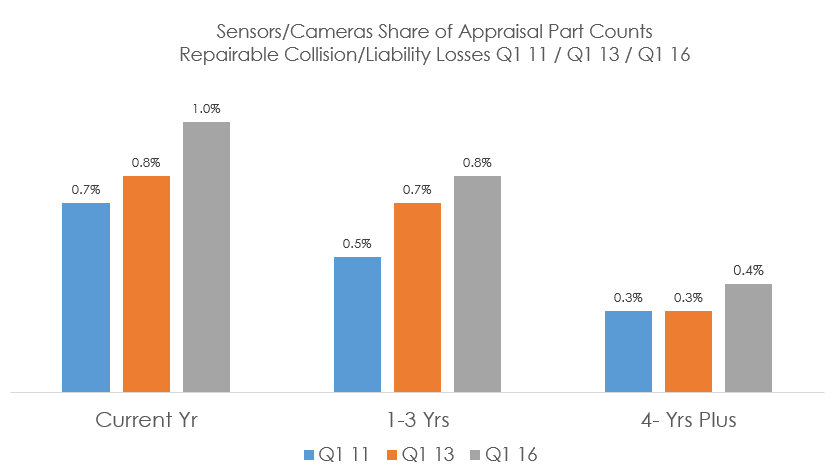
Other factors such as growing vehicle complexity helps explain why repair costs for the newest vehicles is outpacing that of the older model year vehicles.
For example, analysis of parts level detail reveals the newer vehicles show more appraisals that include repair/replace/R&I of electronic components such as distance sensors, speed sensors, yaw sensors, impact sensors, cameras, etc. In Q1 2016, these parts accounted for 1 percent of all parts included on appraisals for vehicles of current model year vehicles, versus less than ½ a percent for vehicles 4 years of age and older. The rate of increase is also faster on the newest vehicles.
For repairers, the shift to the newer mix is happening even sooner. Comparison of the age group share of volume for vehicles actually repaired versus all appraisals reveals the heavier skew among repaired vehicles to the newer age groups.
Specifically, repairers tend to repair a newer subset of vehicles than the age mix across all repairable appraisals written. Subsequently the data set for vehicles actually repaired versus the data for all repairable appraisals tends to have more parts replaced, and more labor hours per appraisal – both which saw further growth between CY2014 and CY2015 as the mix shifted newer.
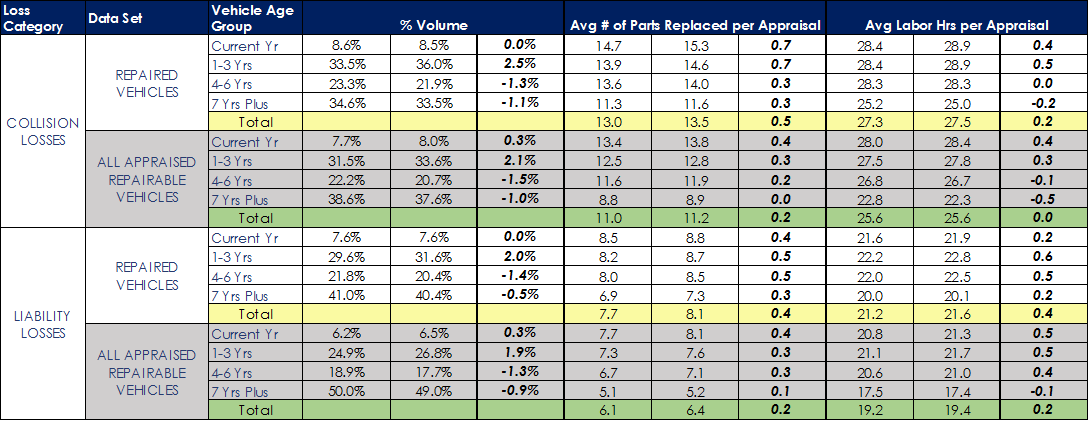
As the vehicle mix shifts further to a newer population of vehicles, repairers will see a growing share of their repair order dollars from parts versus labor (repairers have historically seen better from labor). This will mean added pressure to their overall business margins in an environment where costs are rising.
Total Loss Vehicle Mix on the Move
Total loss claims are also experiencing a shift to a slightly newer mix after numerous years where the vehicle mix saw growth in the oldest segment. As more volume shifts to the newer age groups where values are higher, the claim costs for total loss claims overall rises.
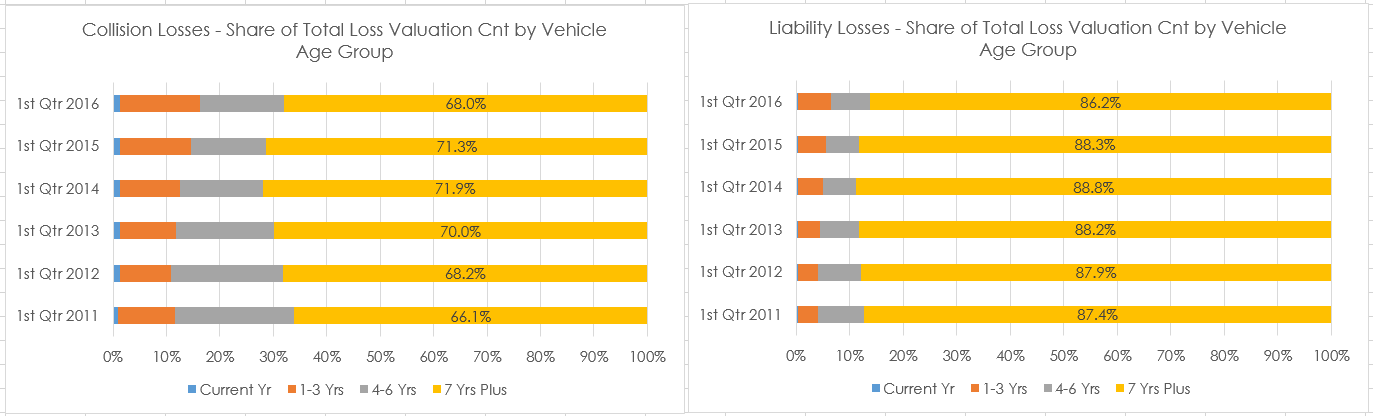
At the same time, volume shift continues to reflect changing consumer preferences for light trucks, and SUV’s (includes CUV’s) in particular.
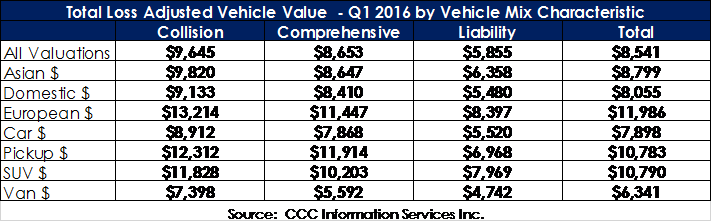
Comparison of the adjusted total loss vehicle value in Q1 2016 by different vehicle mix characteristic illustrates the fairly broad range in values for light truck categories versus cars, and non-domestic vehicles versus domestic. And while none of this trend towards more non-domestic vehicles and light trucks is new to just this year, the trend continues, and is further reason why total loss costs continue to experience elevated pricing.
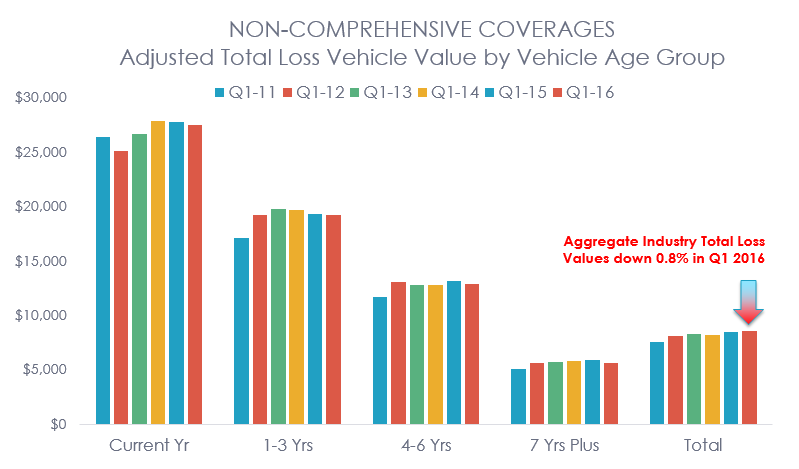
And while vehicle mix changes can drive vehicle values, with lower total loss adjusted vehicle values now appearing within each age group, the industry’s aggregate adjusted total loss vehicle value is experiencing one of its first small declines in several years. Whether this will continue or not throughout the remainder of the year depends in part on further changes in the mix of total loss vehicles by loss category, vehicle type, vehicle source, vehicle age, etc.
Used vehicles, like nearly all things sold in the marketplace tend to have a floor and a ceiling in their prices. With greater supply of used vehicles, the ceiling for used vehicles is already beginning to fall, specifically for the newer models where the supply has grown. Yet still today, the vast majority of total loss vehicles are aged 7-years and older where supply of used vehicles will see substantially less additional supply, and continued growth of subprime loan approval rates may keep the older, less expensive vehicles in high demand. Subsequently, in CY 2016, it is likely that total loss claim costs will only flatten over time or see only very moderate declines.
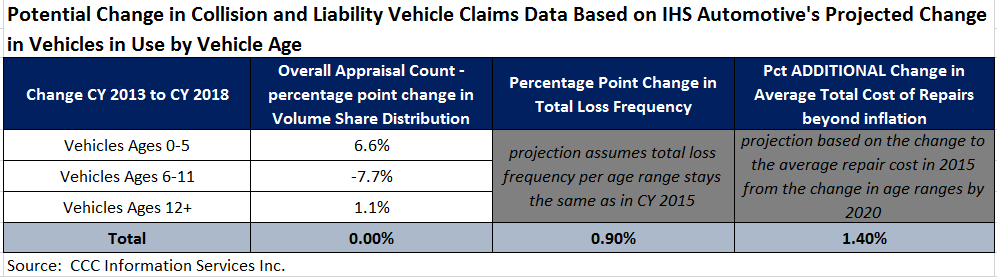
Applying rates of change projected for the U.S. vehicle fleet by IHS Automotive to the current CCC vehicle claim mix by vehicle age results in an increase in newer age vehicle claims where total loss frequency is lower but repair costs are higher, and a smaller increase in older age vehicle claims where total loss frequency is highest. 17
In summary, the automotive claim and collision repair industries can expect to see further growth in newer model year vehicles over the next three to five years as new vehicle sales remain strong. With light truck sales, and higher content vehicles in general accounting for growing share of sales, this will also put added pressure to both repair costs and total loss costs.
Download this article
Fill out the form and download this article as a PDF
Sources
[1] Villegas, Phillip. “WardsAuto Megadealer 100 Passes $206 Billion Mark.” May 18, 2016. www.wardsauto.com.
[2] April 2016 Manheim Used Vehicle Value Index. https://publish.manheim.com/en/services/consulting/used-vehicle-value-index.html.
[3] April 2016 Manheim Used Vehicle Value Index. https://publish.manheim.com/en/services/consulting/used-vehicle-value-index.html.
[4]Snyder, Jesse. “Monster month for truck sales.” May 7, 2016. www.autonews.com.
[5] Schweinsberg, Christie. “More Than Ever, CUVs Seen as Long-Term Trend.” www.wardsauto.com, April 21, 2016.
[6] Snyder, Jesse. “Monster month for truck sales.” May 7, 2016. www.autonews.com.
[7] “Dealership Newsmaker Q&A Mark Seng.” www.searchautoparts.com, Feb 2, 2016.
[8] Ibid.
[9] Ibid.
[10] Nussel, Phil. NADA. Automotive News webinar. “Used-Vehicle Market Update and 2016 Outlook.”
[11] “Non-prime & subprime growth help open balances surpass $1 trillion.” May 19, 2016. www.autoremarketing.com.
[12] Overby, Joe. “Retail used-car transaction price hits Q1 record.” May 19, 2016. www.autoremarketing.com.
[13] Overby, Joe. “Retail used-car transaction price hits Q1 record.” May 19, 2016. www.autoremarketing.com.
[14] April 2016 Manheim Used Vehicle Value Index. https://publish.manheim.com/en/services/consulting/used-vehicle-value-index.html.
[15] NADA Guidelines: NADA Used Car Guide Industry Update. May 2016.
[16] April 2016. https://publish.manheim.com/en/services/consulting/used-vehicle-value-index.html.
[17] Naughton, Nora. “Average age of U.S. fleet hits record 11.5 years, IHS says.” www.autonews.com, July 29, 2015.