
(This article was first published in PropertyCasualty360.)
Economic recovery, cheap gas prices, more vehicles on the road overall, and more miles driven per vehicle have been attributed with much of the increase in auto accident/claim frequency coming out of the recession, and in particular in CY 2015 and CY 2016 to date.
Overall miles driven in the U.S. are up 4.2 percent nationally when comparing the rolling 12 months ended May 2016 to the last peak set during the rolling 12 months ended November 2007.1
Year-over-year miles driven are up 3.1 percent for the rolling 12 months ended May 2016 versus same period ended May 2015.
Some states are seeing larger increases than others, but all but two states are up year-over-year (see Figure 1).

What can often get overlooked however is just how much of a role Mother Nature has played in driving up auto claim counts, especially in the first half of 2016.
A recent report issued by PCI/ISO on Q1 2016 financial results of U.S. property/casualty insurers reports severe weather and the resulting insured losses helped produce a 26.6 percent drop in U.S. property/casualty insurers’ net income.2 Significant hail in states such as Montana, Texas and other states added to the highest first-quarter catastrophe losses in the U.S. since the 1994 Northridge earthquake.3 According to the PCI/ISO report, Q2 2016 direct insured property losses from U.S. catastrophes were $4.8 billion, versus the Q1 2015 losses of $3.6 billion, and $3.1 billion higher than the first quarter direct catastrophe loss average for the previous 10 years.4
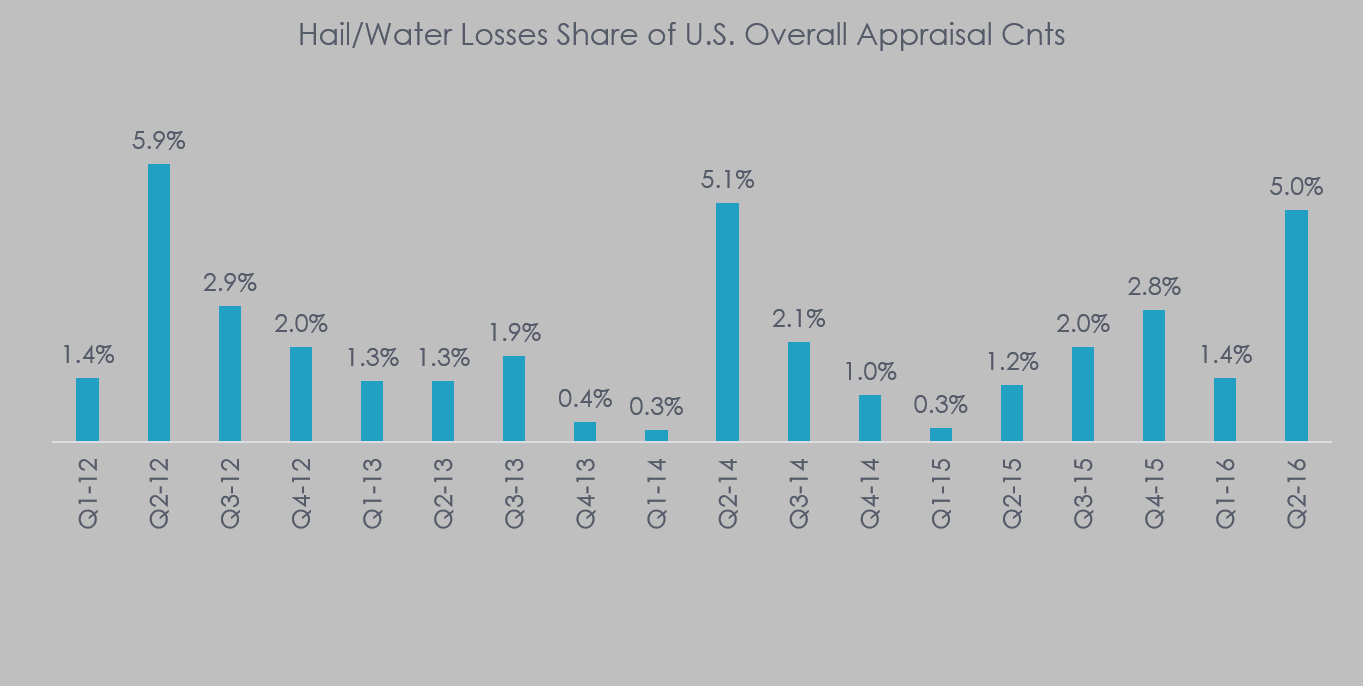
Analysis of customer claim count data from CCC Intelligent Solutions reveals significant weather events in many parts of the U.S. led to large increases in losses from either hail or water (see Figure 2). In Q2 2016, 5 percent of the 6.9 million losses reported by CCC nationally were identified as resulting from water or hail, up significantly from only 1.2 percent in Q2 2015.
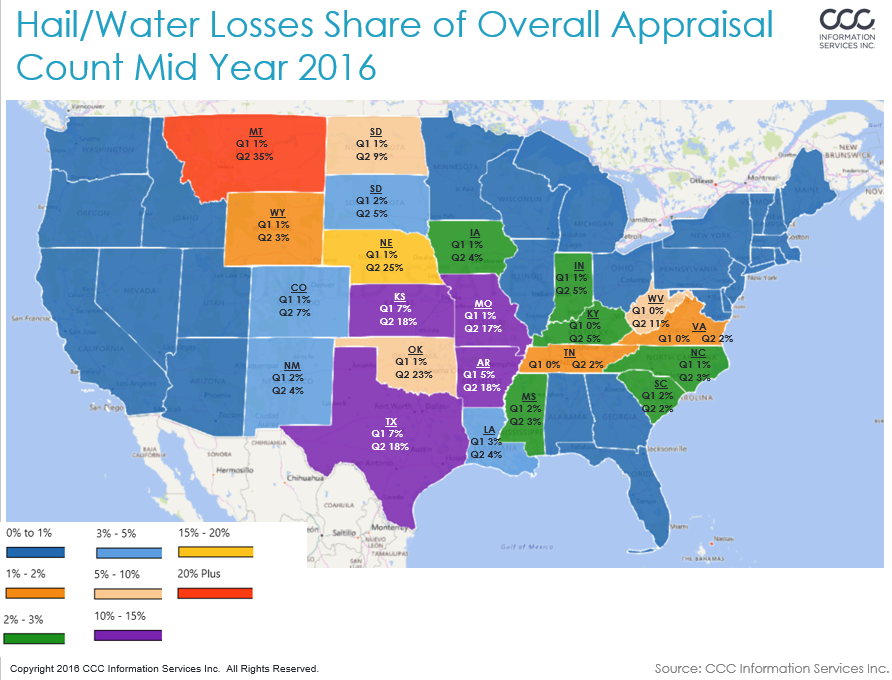
Many states saw the largest losses in the March and April timeframes, with states like Montana swinging from 1 percent of all losses from hail/water losses in Q1 2016, to 35 percent for Q2. Detailed data on individual weather events recorded by Aon Benfield include these specific examples:
Week ending Mar 18: Southern Plains and Southeast saw experienced severe thunderstorms Mar13-17 that brought flooding, hail, damaging winds, tornadoes, and convective storm damage – especially in parts of LA, AR, MS, and east Texas.
The Pacific Northwest also sustained damage from flooding and storms. On March15 the Midwest (IL, IA, MO) saw significant thunderstorms and hail reported as large as baseball size. Thunderstorms on March 16-17 across TX and OK brought tennis-ball size hail in greater Dallas-Fort Worth TX metro area during morning rush hour.5
Week ending March 25: On March 23 thunderstorms hit Iowa to Southern Texas, with at least 6 states reporting significant hail damage. Dallas-Fort Worth, TX area saw golf ball sized hail, damaging about 50K vehicles. Similar damage in OK, AR, MO. March 24th storm moved east extending from the Ohio Valley to the Gulf Coast – MS, AL, TN, KY, IN hardest hit. The 2 storm events in TX (Mar 17-18 and Mar 23) are each individually expected to enter the Top 20 costliest insured loss event for the state of Texas since 1950. 6
Week ending April 1: March 30-31 there were severe convective storm across eastern U.S. that included thunderstorms, hail, damaging straight-line winds; the Plains, Midwest and Southeast were all affected. More thunderstorms reported Mar 30-31 Central Plains to Midwest – tornadoes and hail in OK and KS, more hail in Dallas. Storm then moved across country creating flooding, thunderstorms TN, KY, MS, AL and LA.7
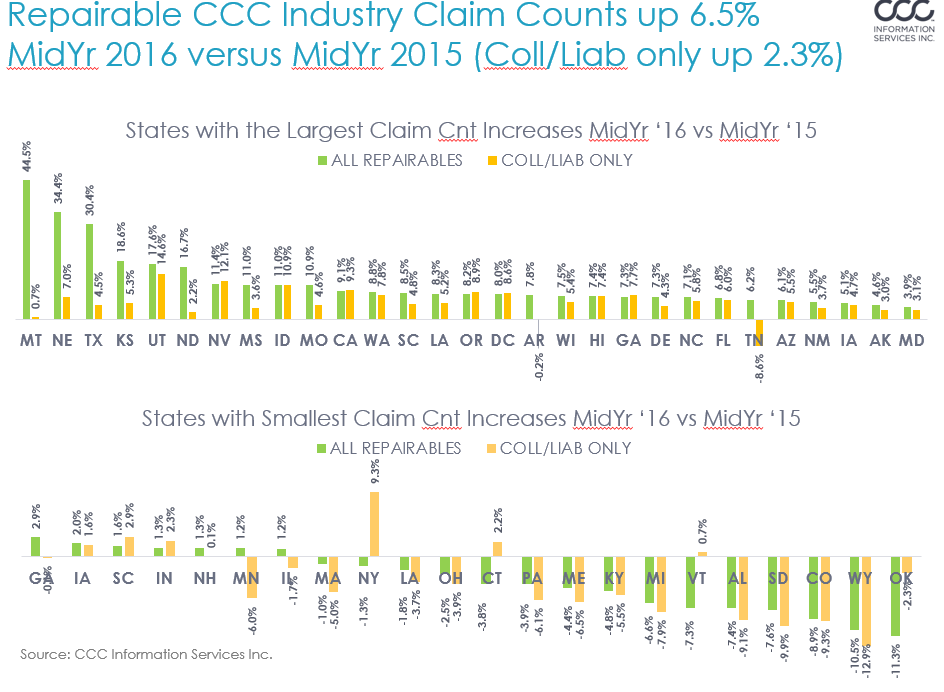
Subsequently, when comparing increases in claim count with and without comprehensive losses included, the swings in volume growth by state vary significantly (see Figure 4). Nationally CCC reports repairable vehicle appraisal counts up 6.5 percent year-to-date through June 2016 compared to the same period in 2015; when comprehensive losses are excluded however that same count was up only 2.3 percent.
There was however a much larger increase in vehicles flagged total loss, as weather events and an older vehicle fleet still on the road led to more vehicles being non-repairable.
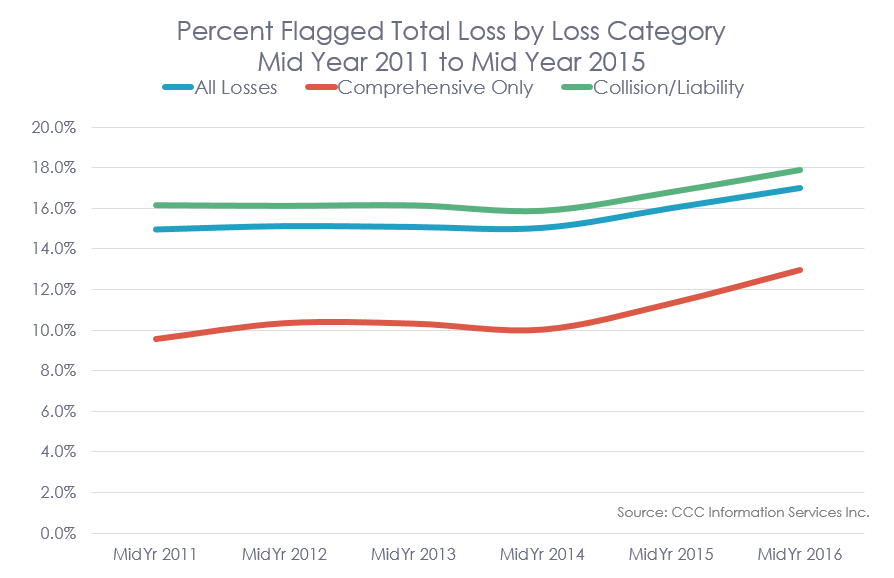
Nationally the percent of vehicles flagged total loss or non-repairable was nearly 17 percent mid-year 2016 across all losses; for comprehensive losses only 13 percent were flagged total loss, while collision and liability losses saw nearly 18 percent flagged total loss. Each loss category group saw about a 1 percentage point increase in total loss frequency so far this year versus mid-year 2015 (see Figure 5).
Total loss volume in certain states also saw significant swings. For example devastating storms in late June led to flash-flooding in West Virginia, causing damage to up to 5,500 homes, 125 businesses and swaths of infrastructure.8 Total loss valuation counts were up 62 percent for the first six months of 2016 from the same period in 2015; when comprehensive losses are excluded however, those same counts were up only 7.8 percent.
In summary, Mother Nature has played a major role driving up claim counts so far this year, as a very strong El Nino event has had significant impact on weather patterns across the country. As we head into the late summer and early fall, the developing La Nina will strengthen and become the dominant driver of North American weather. The Weather Network predicts the warm weather pattern for the summer will persist into fall, driving up tropical storm activity in the Atlantic Basin.9 Seven hurricanes or tropical storms over the last 10 years have caused at least one billion dollars of damage in the U.S.; 5 of the 7 came during the La Nina years of 2008 and 2011.10 And, unfortunately, the risk for a strong La Niña is enhanced following a strong El Niño, which we had last year – so not much relief may be in sight anytime soon. 11
Sources:
1.US DOT FHWA Office of Highway Policy Information Travel Monitoring.
2.“Q1 Troubles: Catastrophe Losses Knocked Net Income Down 26.6 Percent.” Carrier Management, July 14, 2016. http://www.carriermanagement.com/news/2016/07/14/156596.htm.
3. Ibid
4. Ibid.
5. Aon Benfield. Analytics|Impact Forecasting: Weekly Cat Report. http://catastropheinsight.aonbenfield.com/Reports/20160318-1-cat-alert.pdf.
6. Aon Benfield. Analytics|Impact Forecasting: Weekly Cat Report. http://catastropheinsight.aonbenfield.com/Reports/20160325-1-cat-alert.pdf
7. Aon Benfield. Analytics|Impact Forecasting: Weekly Cat Report. http://catastropheinsight.aonbenfield.com/Reports/20160401-1-cat-alert.pdf.
8. Aon Benfield. Analytics|Impact Forecasting: Weekly Cat Report. http://catastropheinsight.aonbenfield.com/Reports/20160622-1-cat-alert.pdf
9. https://www.theweathernetwork.com/us/news/articles/us-weather/2016-summer-forecast/68066
10. http://www.cnn.com/2016/06/15/weather/weather-el-nio-dead-la-nia-coming/
11. Ibid.