
(This article was first published in Insurance Networking News.)
With economic recovery and cheap gasoline prices, Americans have taken to the road again. With many in the midst of planning for 2017, understanding how increased miles driven may drive up auto claim frequency further is top of mind. In this article we’ll discuss some of the primary drivers behind changes in miles driven overall and per vehicle (the better metric when determining impact to frequency) and whether or not we think we’ve seen the largest increases to date, or whether more can be expected in the coming years.
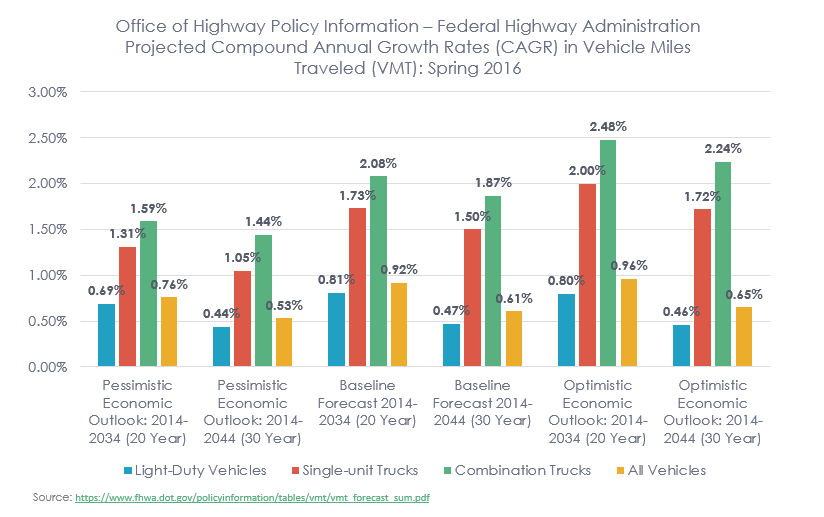
In their “FHWA Forecasts of Vehicle Miles Traveled (VMT): Spring 2016”, the Office of Highway Policy Information, released their projected compound annual growth rate (CAGR) for the next 20 and 30 years in U.S. nationwide vehicle miles traveled with a low, baseline, and high economic growth outlook.1 Using the CAGR for vehicle miles traveled or miles driven in the U.S. helps provide a more consistent view of how miles driven have grown over time, helping smooth out the volatility seen over time from swings in gas prices and economic growth.
The FHWA national VMT projections are created using statistical models that incorporate key economic and demographic factors that affect historical variation in motor vehicle use through 2014; these models are then used to develop forecasts that begin in 2015 and extend through 2044.
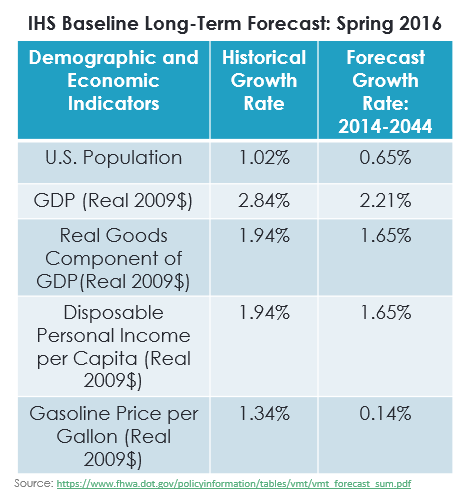
The FHWA forecasts use long-term economic and demographic forecasts produced by the economic forecasting firm IHS which expects population growth will moderate, and steady growth in employment, business investment, and productivity will lead to continuing gradual increases in GDP and personal income.2 Energy prices are expected to slowly return to a long run average of about $3.30 per gallon (in 2009 dollars) by 2025, then remain steady through 2044.3
Based on the IHS data and the FHWA’s own analysis, the baseline CAGR for VMT for the next 20 years is 0.92 percent and for the next 30 years is 0.61 percent.
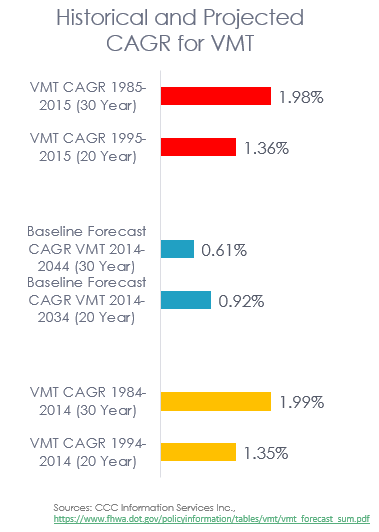
Comparison of the FHWA’s projections to the historical compound annual growth rate in vehicle miles driven in the U.S. nationally from 1994-2014 (prior 20 years) and from 1984-2014 (prior 30 years) reveals larger increases historically. For example, the prior 20 years ending 2014 shows a CAGR of 1.35 percent, while the prior 30 years ending 2014 shows a CAGR of 1.99 percent. And, if we look at the data including CY 2015 where miles driven experienced significant growth, both the historical 20 year (1995-2015) and 30 year (1985-2015) CAGR’s are even higher: 1.36 percent and 1.98 percent.
With these pretty significant differences in historical versus projected growth rates, the challenge remains – what can we expect to happen to miles driven in the U.S. in the next three to five years – a key metric proven to correlate to increases in auto accident frequency?
The recent increases in miles driven in the U.S. can be attributed to growth in both the U.S. vehicle population as well growth in the miles driven per vehicle in the U.S. According to data from Experian, U.S. light-duty vehicle registrations grew year-over-year about 2.7 percent between CY2014 and CY 2015, the largest increase in several years, and certainly since the end of the last recession.4 Much of the increase in registrations had to do with the record new vehicle sales in CY2015 – 17.47 million vehicles sold, beating the record last set in CY2000. Recent sales data suggests the industry may have hit a ‘plateau’, and eke out only a very small increase of just about 1 percent in new sales this year, if at all.
If growth in registered vehicle counts slow, but miles driven continue to grow at the same clip they have for the first several months of this year – about 3 percent, then essentially we will continue to see more of the same trend as in 2015. Miles driven per vehicle will continue to outpace growth in overall vehicle fleet (which is also still expected to grow albeit at a slower rate), subsequently keeping a key metric correlated to auto accident frequency at an elevated level.
When we look at miles driven data across claims data (pulled from vehicle appraisals / all vehicle conditions/ collision and liability losses only) we see perhaps an even more nuanced view of miles driven data.
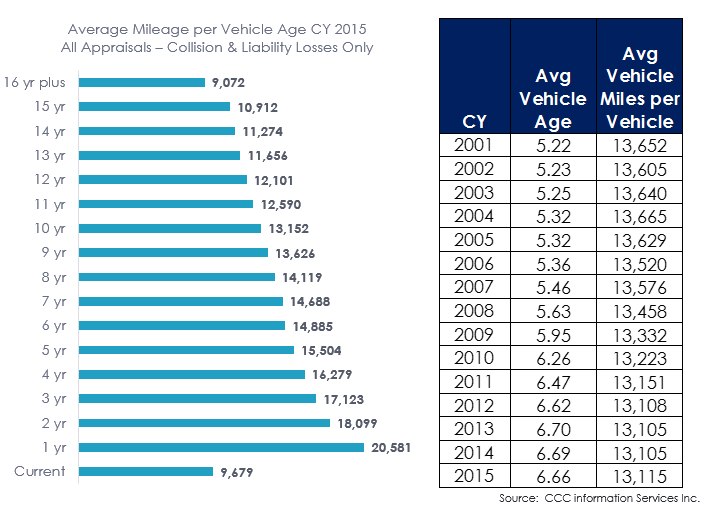
Analysis of the average mileage by vehicle age of auto claims over the last fifteen years shows clearly that as the vehicle ages, the average miles per year tends to fall. This difference could likely be based on how each vehicle is used, the number of other vehicles in the household overall, or perhaps even the demographics of the driver using the newer versus the older vehicle and the types and numbers of trips they take.
With older vehicles showing fewer miles per year, it would make sense that an older mix overall would result in fewer average annual miles, and that may be part of what has explained the drop overall across all collision and liability claims over the last several years as the average age of vehicles has grown. As the average age of vehicles is now beginning to fall again, perhaps it should not be that surprising that miles driven on average per vehicle is also starting to grow.
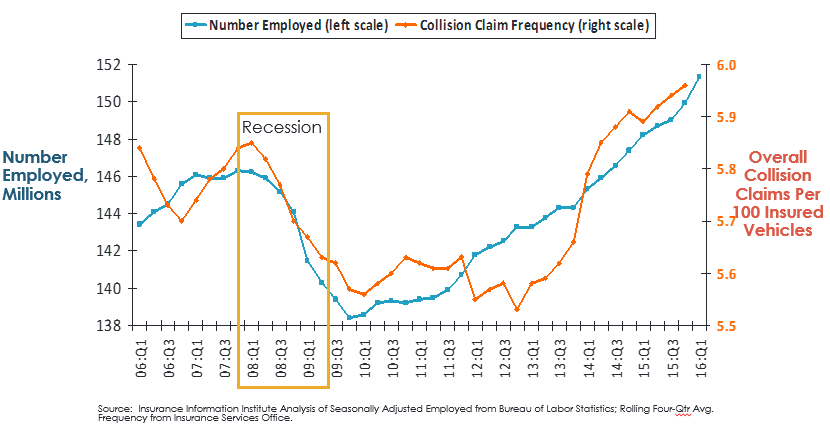
Certainly improved employment means more people are on the road as this analysis from the Insurance Information Institute nicely illustrates.
The full year unemployment rate for the U.S. in CY 2015 was 5.3 percent, and dropped further to 4.7 percent and 4.9 percent by May and June 2016 respectively. In January 2001, the unemployment rate was 4.2 percent – the lowest rate in the last 15 years; so the U.S. has seen good recovery, and has likely seen the largest increases in collision claim frequency related to improved employment already. When the labor force participation rate is considered this last point is further reinforced, as the current rate of 62.7 percent is among the lowest historically, but is being driven most by the large number of baby-boomers starting to retire.
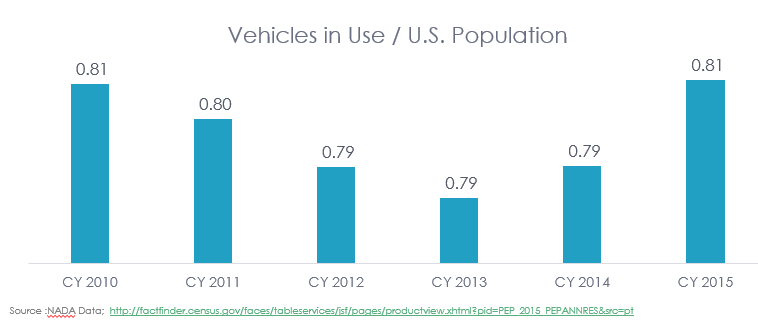
Additionally, if we look at the latest estimated U.S. resident population and divide the overall number of vehicles in use in the U.S. it would suggest that the country is experiencing an increase in the number of vehicles per person again.5 So, even if miles driven per person continue to grow as they have coming out of the recession, with more vehicles per person it suggests the miles may be spread out across more vehicles, potentially slowing the miles driven per individual vehicle.
So, while miles driven are anticipated to see further growth, projections from the FHWA suggest the rate of growth will slow in the next 20 to 30 years from what we’ve seen in the last 20 to 30 years, although it’s unlikely the industry will experience significant slowdown in the near term.
In fact, a recent announcement by Uber suggests potentially miles driven per vehicle may actually grow, as ride-sharing and other alternatives to traditional vehicle ownership models see growth. On June 18, 2016, Uber announced it had logged 2 billion rides; with 1 billion of those coming within only 6 months after they hit their first billion miles.6 Additionally, data on business expenses from the company Certify reveals that Uber overtook rental cars in overall business dollars expensed in 2015, accounting for 43 percent of the spend versus 40 percent for rental cars and the remainder for taxis.7 As Uber and other services like it expand their footprint, the miles driven per vehicle specifically on their fleet will grow.
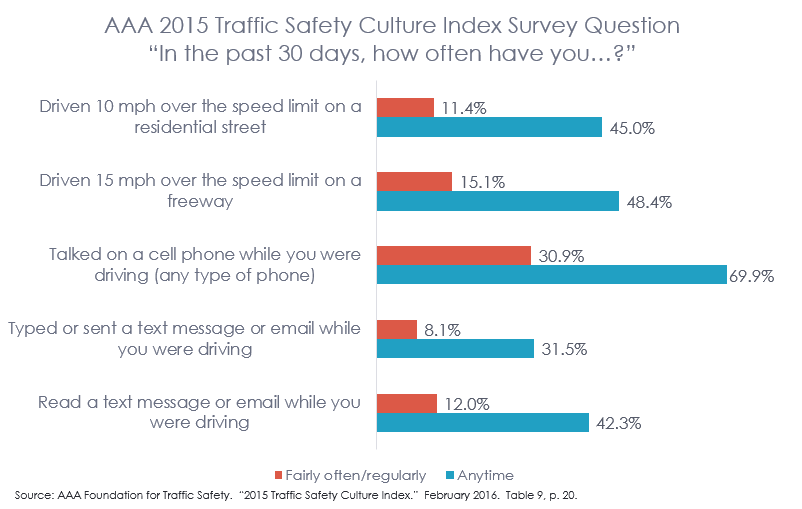
And with growing levels of driver distraction, and higher average speeds on many of the roads and highways in the U.S., accident frequency is unlikely to fall anytime soon. A 2015 survey conducted by AAA confirmed that many drivers have at least occasionally used their phone to talk, text or email while driving.8 And, data from the Insurance Information Institute confirms a correlation between higher speeds and road fatalities, with an 8 percent increase in fatality rates on interstates and freeways for every 5 percent increase in maximum state speed limits, and a 4 percent increase in fatalities on other roads for similar increases in speed limits.9
Clearly the industry is in for similar or even slightly more increases in frequency over the near term. This combined with the fact that claim costs are also rising means insurers will continue to face similar challenges in the next several years until the technology designed to reduce accident frequency experiences greater market penetration.
Contact Us
Fill out this form to save this article as a PDF.
Sources:
1 https://www.fhwa.dot.gov/policyinformation/tables/vmt/vmt_forecast_sum.pdf.
2 https://www.fhwa.dot.gov/policyinformation/tables/vmt/vmt_forecast_sum.pdf
3 https://www.fhwa.dot.gov/policyinformation/tables/vmt/vmt_forecast_sum.pdf.
4 Experian Information Solutions, Inc. “Experian Automotive Quarterly Briefing: First Quarter 2016 automotive market share trends and registrations.”
6 Somerville, Heather. Reuters. “Uber logs 2 billion rides 6 months after hitting first billion.” July 18, 2016. www.autonews.com.
7 Zaleski, Olivia. “Uber overtakes rental cars among business travelers.” www.autonews.com, April 21, 2016.
8 AAA Foundation for Traffic Safety. “2015 Traffic Safety Culture Index.” February 2016. Table 9, p. 20.
9 “Speed limit increases cause 33,000 deaths in 20 years.” IIHS Status Report, Vol. 51, No. 4. April 12, 2016.