
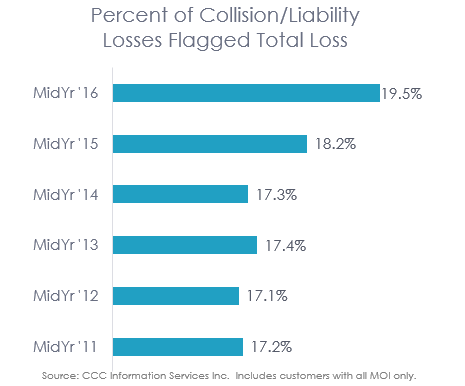
Total loss frequency continues to be elevated as we head into the second half of CY 2016. When looking at collision and liability losses the percent of vehicle appraisals flagged total loss for the 1st half of 2016 is the highest seen in the last six years (see Figure 1).
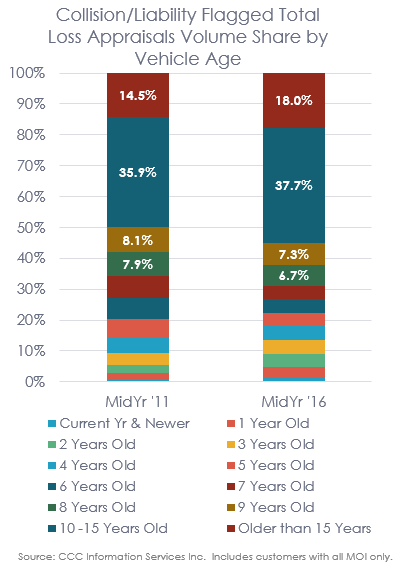
In large part, much of the increase in total loss frequency is due to the remaining volume of older model year vehicles still on the road in the U.S. Analysis of these same collision/liability losses from mid-year 2011 to mid-year 2016 reveals vehicles aged 10-years and older increased in volume share of flagged total loss appraisals from 50 percent to 56 percent (see Figure 2).
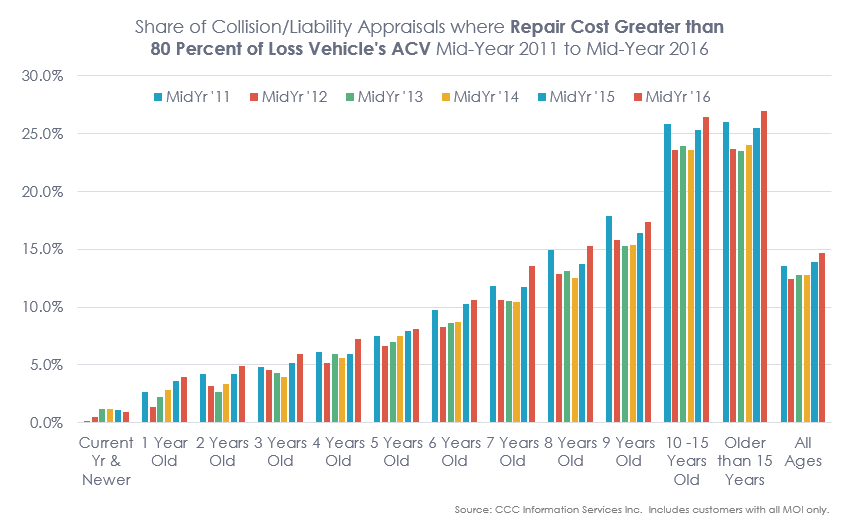
Not surprisingly, as vehicles age, more of them are flagged total loss. With average repair costs for these flagged total loss appraisals of $5743 for vehicles aged 10-15 years, and $3599 for vehicles aged 15-years plus, it doesn’t unfortunately take much damage before the total loss threshold is met; average vehicle values for vehicles of these age ranges are $6191 and $5549 respectively. Analysis of the percent of each vehicle age where the repair cost was 80 percent or more of the loss vehicle’s ACV reveals many more in the older age groups fall into this category, and subsequently are deemed total loss (see Figure 3).
So why do we see a larger number of vehicles hitting total loss thresholds again? In large part more vehicles are hitting higher total loss thresholds because vehicle values are beginning to soften as supply of used vehicles in the marketplace has grown.
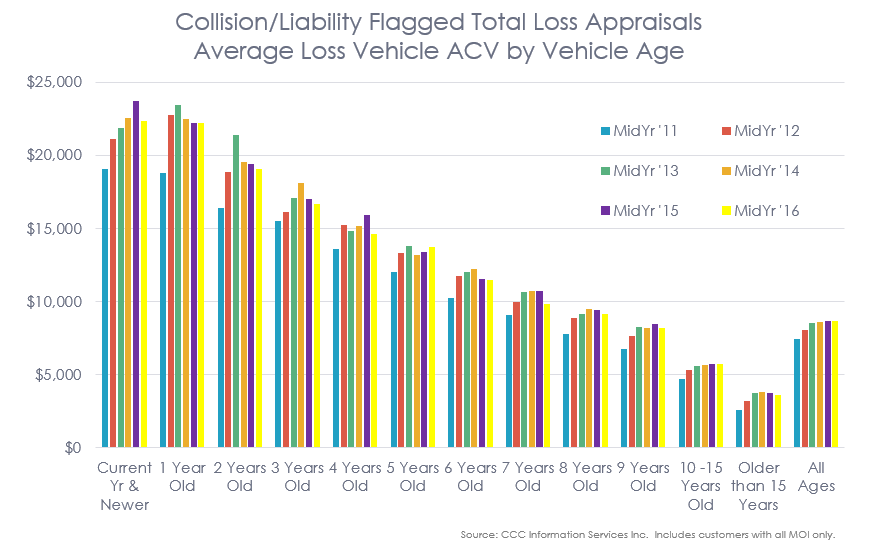
Evidence of the slight decline in vehicle values experienced to date can be seen when comparing the change in the average loss vehicle’s value from by vehicle age from mid-year 2011 to mid-year 2016. And while there are other factors that can result in a higher or lower average aggregate value (i.e. more trucks or more higher-end vehicles), Figure 4 suggests vehicle values are beginning to soften some – particularly for collision/liability loss vehicles flagged total loss.
Demand for used vehicles has remained strong over the last several years; and according to Edmunds.com, there were 10.14 million used-vehicle retail sales in the first three months of 2016 alone – the best first quarter since 2012.1 This is good news especially given the volume of used vehicles the marketplace now has to sell.
National Auto Association’s chief economist Ian Silver expects 9.6 million vehicles will be sold at wholesale vehicle auction in 2016, and 10 million in 2017.2 This exceeds the last record of 9.6 million set in 2004.3 Additionally, anytime new vehicle sales rise, the number of vehicles returning to market, especially via commercial consignment from dealers, also rises.4
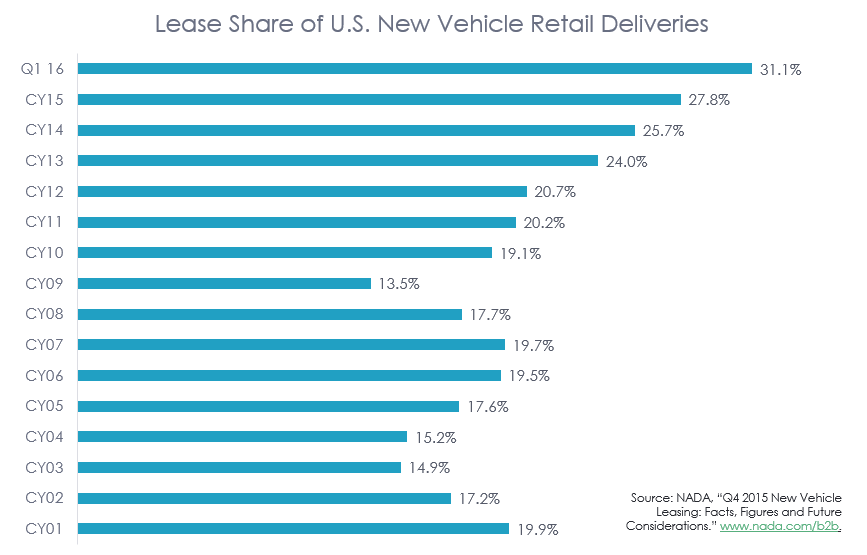
An estimated 28 percent of all new retail vehicle deliveries in CY 2015 were leases, compared to 27 percent in CY 2014, and only 17.6 percent 10 years prior 5(see Figure 5).
In fact, according to research by NADA, 76 percent of the growth in total vehicle retail sales for 2015 through September was attributable to leases, versus 55 percent in CY 2014, and only 25 percent in 2012.6
And leases continue to grow – jumping to 31 percent of all new-vehicle transactions in Q1 2016 according to Experian. 7 This increase in leases guarantees the number of vehicles returning to the marketplace in two, three, or six years (typical lease terms) for sale in the used market will be significant. In fact, Tom Webb from Manheim estimates 3.1 million off-lease vehicles will return to the market in 2016, up from 2.6 million in 2015.8 That number will likely grow further to as many as 3.6 million in 2017 and nearly 4 million in 2018.9
With increased supply anticipated, most analysts are projecting used vehicle prices will finally begin to fall after several years of elevated prices. The rate at which they will fall is dependent on the ability for the market to absorb the increased volume as well as the ability for OE’s to manage fleet sales, new vehicle inventory, and maintain disciplined incentive spending. 10 Through July 2016, auction sales volume is up 6 percent, with the volume of youngest vehicles aged 3 years and younger up even higher at 9 percent. This suggests demand remains strong in the market, consistent with the results recorded by Edmunds.com mentioned above. The popularity of Certified-Pre-Owned vehicles has been a big help in absorbing the increased volume in off-lease vehicles; sales of CPO vehicles have risen substantially since 2011 with sales of 1.32 million in the first six months of 2016 alone, versus 1.74 million in full year 2011 alone.11 And while CPO sales historically were predominantly made up of luxury brands, both luxury and mainstream auto brands are seeing strong increases – particularly those with growth in off-lease volume.12
As we move into the second half of 2016 the industry is beginning to show some signs tempered auto sales, and a pull-back in leasing as well, which dropped to 27.8 percent of new vehicle sales in July, its lowest level since May 2015.13 And the average MSRP of new vehicles sold continues to climb: for July 2016, TrueCar pegged the average transaction price of a new vehicle at $32,518 up 1.3 percent from the prior year, while Kelley Blue Book listed it even higher, at $34,264, up 2.5 percent from the prior year. With higher MSRP’s and greater preference for light trucks, the average auto loan balance grew to its highest level post-recession to $18,177 in Q2 2016 per TransUnion. 14 Leasing historically has been an option to keep the cost of a new vehicle more affordable for many consumers 15, but with prices continuing to rise, even these may be moving out of reach for consumers. This may actually end up being good news for the used vehicle segment: as increased supply of used vehicles continues to apply pressure to their prices, the difference in cost between a late-model used vehicle and a new vehicle continues to grow, and more consumers may opt for a pre-owned vehicle instead.16
Contact Us
Fill out this form to save this article as a PDF.
Sources:
1 Overby, Joe. “Supply helps drive retail used-car market.” Auto Remarketing, July 1-14, 2016, p. 9. www.autoremarketing.com.
2 “Vehicle volume still pumps through auction lanes.” July 25, 2016. www.autoremarketing.com.
3 Ibid.
4 Ibid.
5 NADA, “Q4 2015 New Vehicle Leasing: Facts, Figures and Future Considerations.” www.nada.com/b2b.
6 Ibid.
7 Zulovich, Nick. “Leasing volume even surprises industry watchers.” Auto Remarketing, July 1-14, 2016, p. 12. www.autoremarketing.com.
8 Sawyers, Arlene. “Forecasters see U.S. sales up this year, but softer 2017.” www.autonews.com, January 10, 2016.
9 Ibid.
10 “Auction volume slows from hot start to year, but still up 6%.” http://www.autoremarketing.com, August 15, 2016.
11 “NADA Used Car Guide Perspective: Certified Pre-Owned Vehicles, 2016 Market Update.” August 2016. NADA Used Car Guide, a division of J.D. Power. www.nada.com/b2b.
12 Ibid.
13 “Incentives rise in July as leasing activity softens.” www.autoremarketing.com, August 8, 2016.
14 Zulovich, Nick. “2 drivers of additional 5M auto borrowers in Q2.” www.autoremarketing.com/subprime/ August 17, 2016.
15 “Incentives rise in July as leasing activity softens.” www.autoremarketing.com, August 8, 2016.
16 Ibid.