
(As published in Insurance Networking News.)
There has been a great deal of press and research released in the last several months that have begun to question the how and the when of the advanced safety systems that have begun to make strides within the market. Specifically, what percent of the overall vehicle fleet/auto claim count now has these systems; how well do these systems work in reducing both loss frequency and costs; and when can the industry expect to see measurable impact in both frequency and costs?
How quickly is the vehicle fleet adopting this technology?
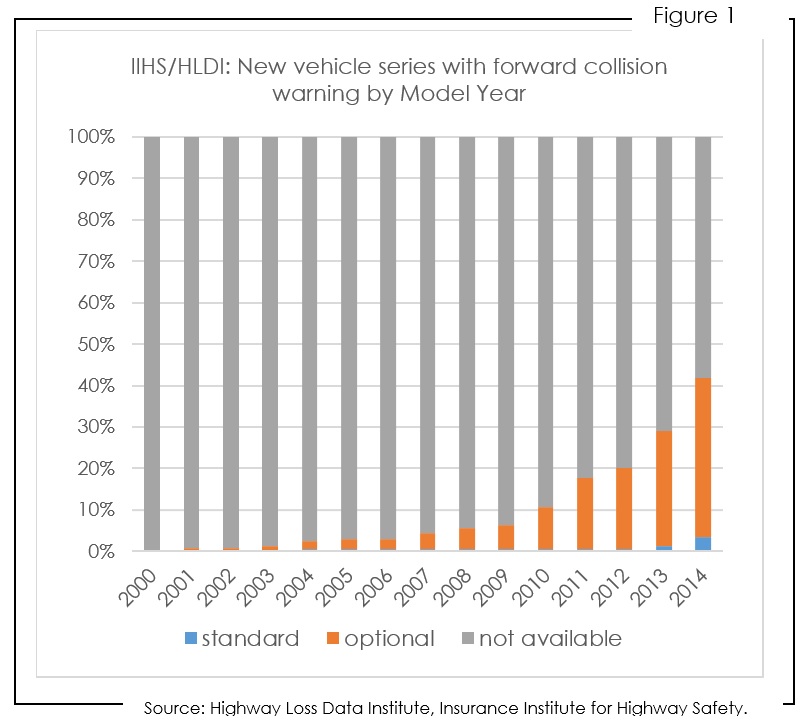
According to the data from the Highway Loss Data Institute, the percent of new vehicle series annually with front crash prevention has grown, so that by vehicle model year 2014, over 40 percent included front crash prevention as either standard or optional vehicle option (see Figure 1).1 Yet, the actual market penetration in terms of share of registered vehicle count is much smaller. HLDI estimates that as of CY 2014, just over 5 percent of registered vehicles included front crash prevention technologies.2
Like many vehicle features, the advanced driver assistance systems (ADAS) started appearing first within the luxury vehicle population. However as Autotrader’s 2016 In-Vehicle Technology Shopper Influence Study found, 70 percent of consumers surveyed are more likely to consider a vehicle with autonomous features like collision avoidance and automatic braking, and now view a vehicle as luxury or not based on the availability of these options: “…technology’s really changing the game, and non-luxury vehicles are starting to be viewed as a luxury vehicle because of the technologies offered in the car. Things like Wi-Fi, lane change assistance, and collision avoidance are helping consumers perceive non-luxury cars as luxuries.”3 In their 2016 U.S. Automotive Performance, Execution and Layout (APEAL) Study(SM), J.D. Power found that new vehicles equipped with safety features like low speed collision avoidance and blind spot detection earn higher scores among consumers surveyed than similar vehicles without those technologies.4
Research from the Highway Loss Data Institute has shown that some of these ADAS are more effective than others in helping to reduce accident frequency for auto property damage and casualty.5 The systems found most effective include forward collision warning, lane departure warning, side assist view (blind spots), and adaptive headlights. If all vehicles were equipped with these systems, HLDI and NHTSA estimates predict the U.S. could see a 6 percent reduction in crashes with injuries, and a 30 percent reduction in fatal accidents.6
A preview of vehicles sold over the last several years shows more automakers are jumping into the mix. According to MOTOR, as of August 2016, vehicles aligned to over 230 distinct MOTOR chapter ids (just over18 percent of the distinct MOTOR chapters defined) included a frontal crash warning or avoidance system as either a standard or optional vehicle component, and subsequently would be equipped with a ‘distance sensor’, a primary component to all frontal crash warning or avoidance systems.
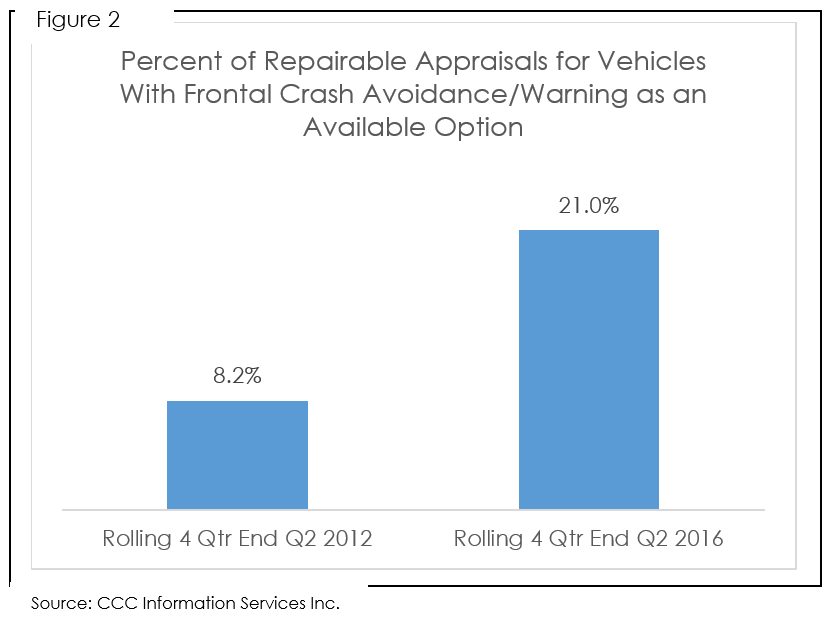
Analysis of automotive claims data uploaded to CCC Intelligent Solutions (CCC) over a rolling 12 month period (Q3-15 to Q2-16), reveals these vehicles models that had frontal crash warning/avoidance available accounted for 19 percent of all appraisals; when filtered to include only those marked repairable, it increases slightly to 21 percent (see Figure 2). A comparison of these same metrics for the rolling 12 months ended Q2 2012 reveals these same vehicle models accounted for 7 percent of all appraisals uploaded, and 8 percent of those same appraisals filtered to include repairable appraisals only. This increase over five years illustrates just how many more automakers are incorporating this technology into their vehicles.
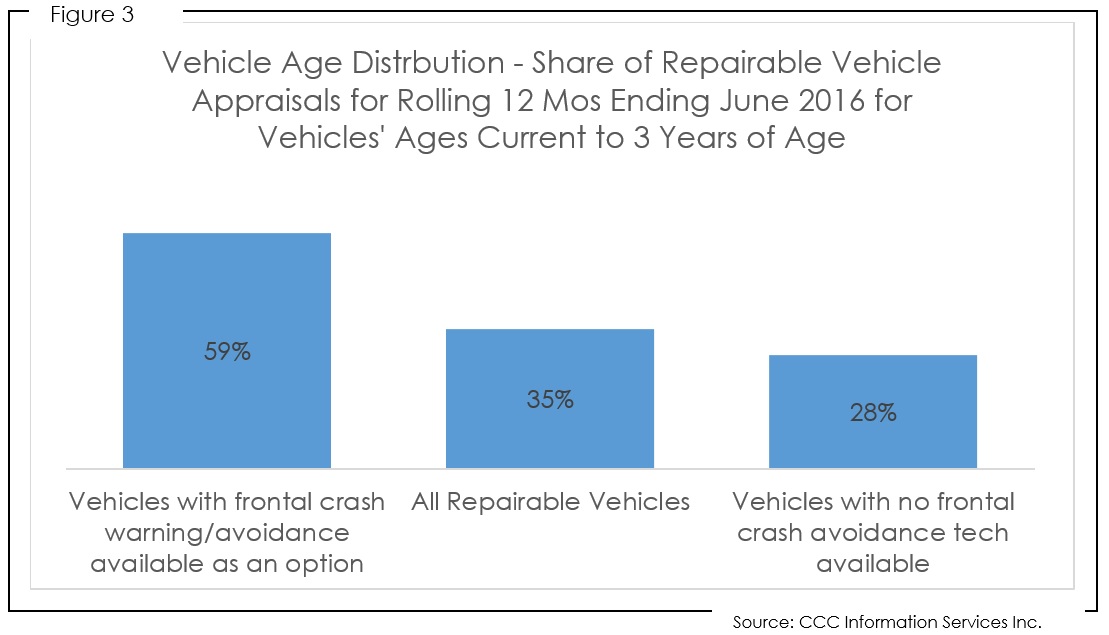
Not surprisingly the 21 percent of repairable vehicle appraisals for those vehicles with frontal crash avoidance/ warning available as an option when compared to all other repairable vehicle appraisals for the same time period tend to be newer and higher end vehicles given the nature of how these ADAS have been introduced into the market.
For example, vehicles aged current to three years of age accounted for 35 percent of all repairable appraisal volume for the 12 months ended June 2016; that same figure for vehicles potentially equipped with a distance sensor was 59 percent (see Figure 3).
Additionally, 30 percent of the these same vehicle models were luxury vehicle makes such as Porsche, Audi, Acura, Lexus, Tesla, etc., versus less than 10 percent for the full population of repairable appraisals.
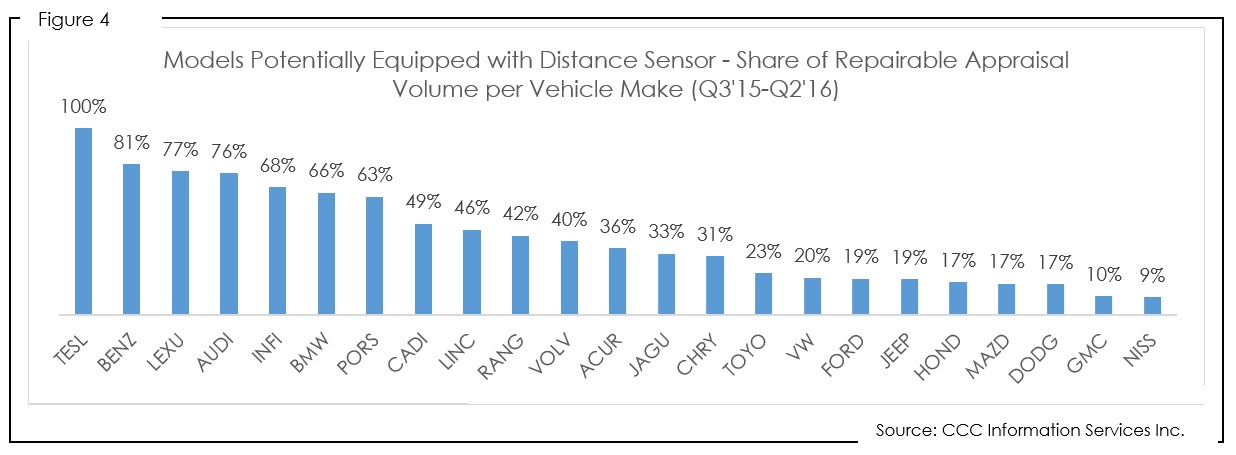
A comparison of the percent of vehicle models per individual vehicle make that potentially had a distance sensor also helps illustrate which automakers have jumped into the ADAS mix fastest (see Figure 4).
In March 2016, NHTSA and IIHS announced a commitment of 20 major automakers representing 99 percent of all vehicles sold in the U.S. annually, to make front crash prevention systems standard on nearly all models by September 2022.7 This commitment, as well as consumer demand, are expected to lead to more models including this technology. In fact, shortly after the March announcement by NHTSA and IIHS, Toyota announced its Lexus Safety System +™ and Toyota Safety Sense™ packages, anchored by automatic emergency braking (AEB), standard equipment on almost every model by the end of 2017.8 Yet despite this 2022 voluntary commitment by the automakers, IIHS still predicts the share of registered vehicles with front crash prevention will not reach 50 percent until CY 2027, and 80 percent in CY 2034.9
A study titled “Capturing the advanced driver-assistance systems opportunity” by McKinsey and Company released in January 2016 identified several key factors driving ADAS adoption based on a survey conducted across five countries: price was the top factor; second was the importance of safety to drivers and their increasing awareness of the technologies’ capabilities.10 As the cost of the technologies comes down and consumer awareness grows, we can fully expect a greater ramp up in these systems than what we have seen in the past. However, with 72 percent of vehicles on the road in the U.S. are still aged six years and older 11, even a growing share of vehicles with the ADAS technologies will be driving alongside many older vehicles that don’t have those systems for quite some time.
How does the implementation of this technology differ among automakers?
Today one of the challenges in tracking market penetration and the effectiveness of these new technologies is that each manufacturer has its own ‘branding’ for its technology, with packages including a wide range of technologies. There is also a wide variation in the design of each system, and whether in the case of frontal crash warning/avoidance, it is designed to simply reduce the speed of the vehicle before impact, or actually bring it to a full stop.
Many consumers are often not aware of how each of these new technologies work, or even whether or not their vehicle includes them. In order to help educate consumers about how these features work, when they should be used, and whether or not they have them in their vehicle, the National Safety Council and the University of Iowa teamed up to create the educational website http://www.mycardoeswhat.com. The website includes helpful descriptions of what each individual technology feature does and does not do, helpful Q&A’s, videos, and even games.
And while this website provides invaluable information for consumers, it is worth noting that the icons used to illustrate each safety feature are not standard across the vehicle fleet, and every automaker may have a slightly different name for each safety feature. For example, “What else is this feature called?” for “Forward Collision Warning” in the website include the following: Pre-crash system; Forward crash warning; Collision mitigating system; Collision avoidance system; Forward collision avoidance system; Rear-end crash avoidance system; and Automotive collision avoidance system.12
Additionally, research by IIHS/HLDI, NHTSA, AAA and others show a wide range of capabilities and performance across the various systems. Among the twelve crash prevention systems from seven auto manufacturers HLDI studied to compare insurance claim rates, the research organization found that across all crash configurations (not just rear-end crashes), claim rates for damage to other vehicles is 10 to 16 percent lower for vehicles equipped with a warning system and autobrake, and 7 to 22 percent lower for vehicles equipped with a warning system only. A comparison across various vehicles of the differences in both frequency and severity per line of coverage when compared to other vehicles not similarly equipped are included in the table below (see Figure 5).
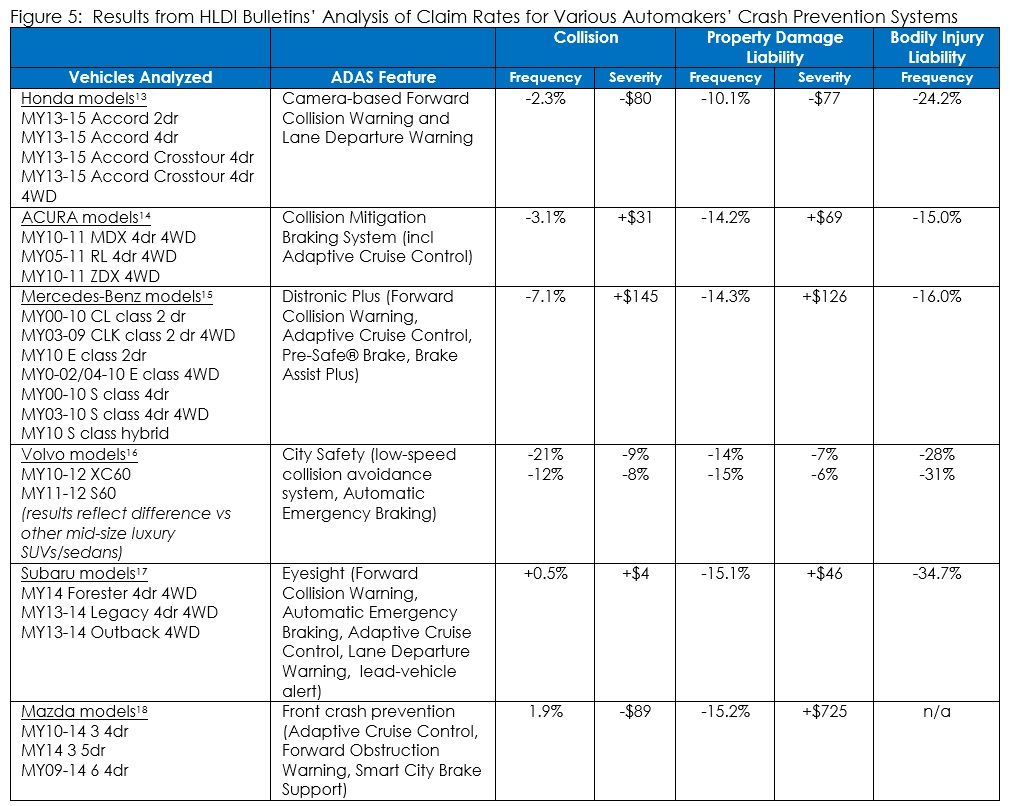
Worth noting is the difference in the average claim cost that in some cases is actually higher than for other vehicles not equipped with the safety technology. Some of the difference may be due to wide variability in the detailed crash information which is not included in the data supplied to HLDI, how each technology is designed to work, or even in some driver characteristics not accounted for. Certainly vehicles equipped with this technology include more parts such as sensors and cameras than other similar vehicles without the safety technology. We will explore what may be driving those additional costs below.
The AAA and the Automobile Club of Southern California Automotive Research Center also recently ran more than 70 tests of five 2016 model year vehicles to compare how they performed when robot-driven towards a static “SoftCar360” at speeds between 20 and 65 miles-per-hour.19 Static testing included a subject vehicle approaching a static target at both 25 and 45 mph. Dynamic tests included a subject vehicle (45 mph, 60 mph) approaching a moving target vehicle (20 mph, 30 mph) and a dynamic cut‐in scenario with a moving target vehicle (35 mph) passing a subject vehicle (30 mph) followed by hard braking.20 What they found was that those vehicles equipped with autobraking systems cut speed by 79 percent in general, but the severity-reduction systems only cut speed by 40 percent. In fact, when the vehicles were raced at 45 mph towards the static vehicle, the autobraking systems avoided 40 percent of crashes and cut speed by 74 percent, while the vehicles with severity-reduction systems cut speed by 9 percent but ran into the SoftCar360 every time. 21
Given the wide array of ADAS technologies in the marketplace today, the variation in how they are packaged, the different designs and goals of each system, and the rate at which each is entering the marketplace it becomes difficult to project what the real long-term impact on auto claim frequency and auto loss costs may be.
Perhaps the best approach still is to use historical claims data to gauge what percent of auto claims might benefit from the ADAS given the mix of auto claims by age, loss coverage, and impact. Next step is to apply an estimate of the ‘take-up’ rate of crash avoidance systems based on availability and consumer purchase, and an estimate of the likely reduction in frequency based on pooled data from analyses performed across automakers and their frontal and rear crash avoidance systems to date.
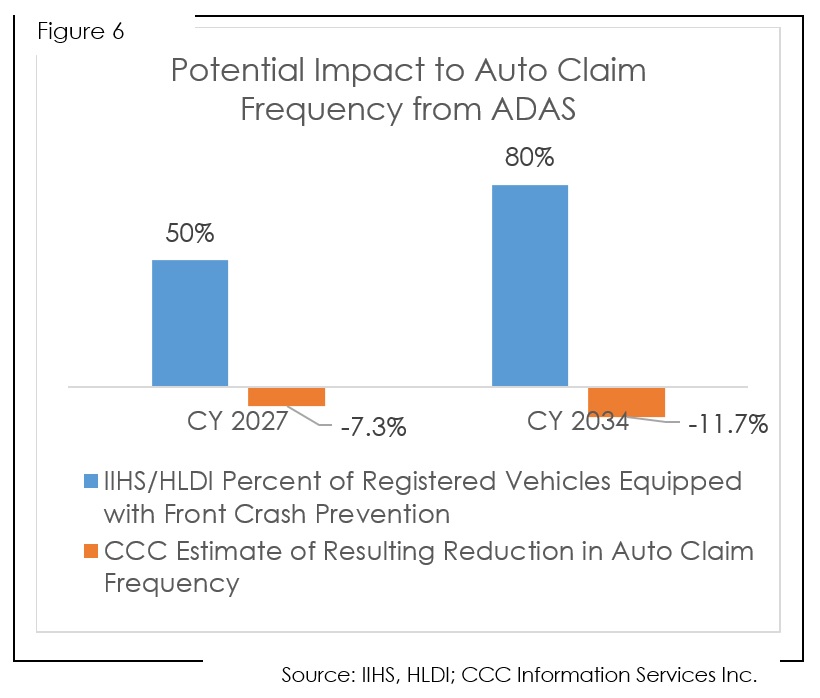
This approach suggests the impact on auto claims to date has been relatively small, and will take time to significantly reduce auto accident/claim frequency. So, if 50 percent of all registered vehicles as HLDI suggests are equipped with frontal crash avoidance by 2027, and 80 percent are so equipped by 2034, the corresponding reductions in frequency could be 7 percent fewer auto claims by 2027, and 12 percent fewer by 2034.
So while this approach does not account for any improvement in the ADAS’s abilities to reduce accidents, and is only a high level estimate, it underscores the inevitable decline in frequency that these systems will have as their market penetration grows.
So what does analysis of the auto claims data tell us so far in terms of impact to loss cost?
Many of the features being added to vehicles today focus on convenience, fuel efficiency, and safety. All of these technologies are driving rapid adoption of microprocessors, sensors, infrared imaging, cameras, radar and other technologies in vehicles. Many of these parts are mounted in parts of the car that often tend to get damaged even in minor accidents such as bumpers, fender, quarter panels, grills, mirrors, lamps, etc. Each of these components are essentially brand new components on a vehicle (typically with no non-OEM alternative) that have the potential to be damaged or misaligned during a vehicle accident, resulting in new labor and parts costs that didn’t exist previously. And, because many of these advanced electronics and driver assist systems don’t provide a visual indication that there is a system malfunction or diagnostic trouble code (DTC), additional labor time to conduct both a pre-repair and post-repair scan to identify what was damaged and ensure it was fixed might also be necessary.22
To illustrate the impact of these additional vehicle components to vehicle repair costs, a comparison of parts and labor costs associated with the repair or replacement of items such as blind spot radar, camera, park sensors, radar sensors, etc. was made for the four quarters ending Q2 2012 (4Q2’12) versus the four quarters ending Q2 2016 (4Q2’16). What we observed was the following:
- The average cost of one of these components in 4Q2’12 was $123; by 4Q2’16 the cost rose to $144.
- The average number of these components replaced per claim grew over 60 percent, from 0.06 in 4Q2’12 versus 0.10 in 4Q2’16.
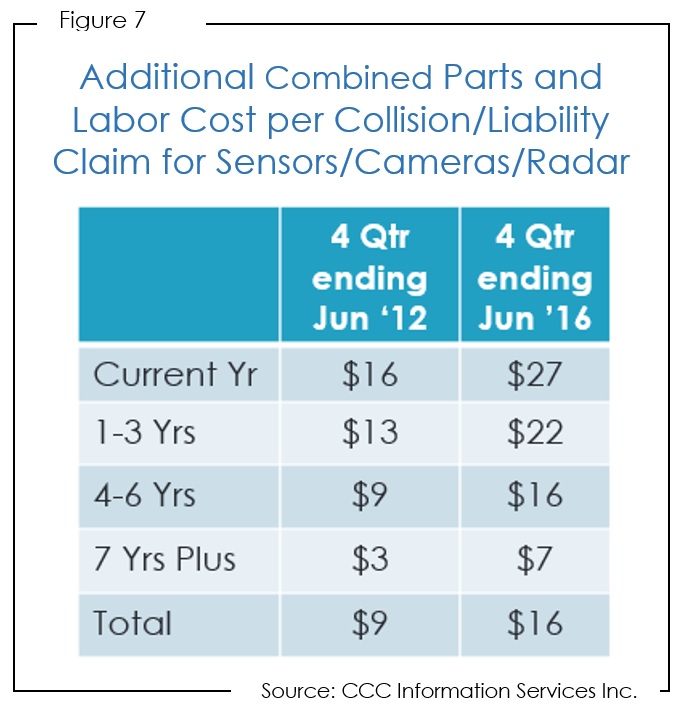
- Combined parts and labor costs per each of these sensor/radar/camera parts has resulted in $16 on average per claim across all claims as of 4Q2’16.
- Given there are more of these parts included in newer model year vehicles, the additional cost per claim is even higher on current model year vehicles – $27 as of 4Q2’16.
The table in Figure 7 shows the additional cost per claim now incurred as the number of cameras, sensors, and radar devices proliferate in the automobile fleet broken out by vehicle age group.
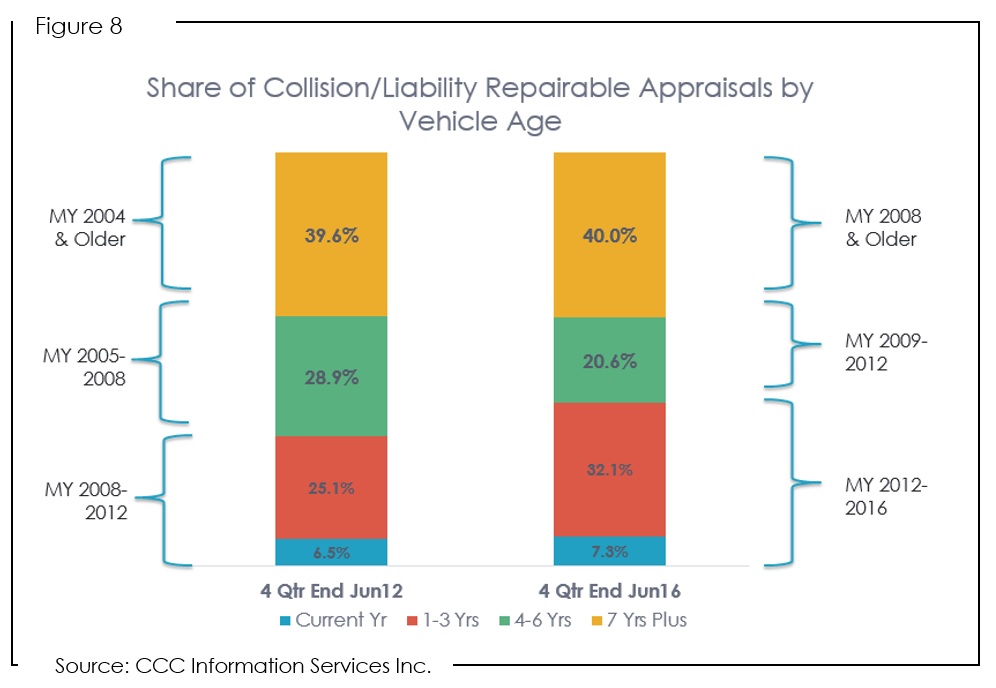
Keep in mind also that moving forward, a larger share of the overall repairable appraisal volume will be comprised of vehicles that incorporate more of this technology. Just compare the vehicle model year make-up for the 4Q2’12 versus 4Q2’16 in Figure 8. Many fewer vehicles in CY 2012 were those equipped with this type of technology; by CY 2016 there are many more.
These additional parts and labor costs don’t include the additional fees associated with diagnosing whether or not other electronic components elsewhere may have been misaligned or damaged during impact that reside in a different area of the vehicle not directly damaged from the accident. Nor do they include the costs of fixing anything that might need repair.
For example, changing anything that affects ride height, braking, steering or lighting can affect a collision avoidance system operation.23 Additionally, adaptive cruise control operation can be affected by any wheel and suspension modifications, including replacing a wheel or tire.
A good example is the 360-degree camera views available on the 2015 F-150 pickup truck. Damage to the side-view mirror alone requires a full recalibration be performed, a process that requires special tools such as calibration mats, access to detailed OEM service information re: DTC’s and other information, a scanning device capable of reading and clearing any fault codes, as well as “…a flat open area…with a minimum of 6 feet of open space to each side, 7 feet of open space in front, and 11 feet of open space behind the vehicle.”24
Recently several automakers have released position statements regarding the need for repairers to conduct pre-repair and post-repair scans.25 Nissan, for example, states “… it is necessary in most repair situations for the vehicle to have a pre- and post-repair scan so that the repairer is informed of any trouble codes present, even in cases where there are no identifier lights on the dash…It is the stance of Nissan North America, that all of our vehicles be scanned following a collision repair…”26 Mopar’s Scan Tool Position Statement includes more specific guidance regarding the types of safety and security related systems that must be tested for fault codes (DTCs) such as air bags, seat belts, forward facing camera and radar, and other automated electronic driver assistance systems. Yet in their description of the collision conditions that could potentially trigger a DTC code before or during a collision repair and lead to later problems, they include “Vehicle is involved in an accident or collision, even though the damage may appear minor.”27 And while not every automaker has yet to release a position statement, many more OE’s indicated they would be doing so in the near future.
Today there are three types of scan tools available: OBD-II generic, OBD-II enhanced, and factory scan tools. Each provide varying levels of information re: the fault codes (diagnostic trouble codes, or DTCs), which by themselves do nothing other than lets you know that a fault has been detected, not what caused it, or how to fix it. All scanner tools display “generic” or “global” OBD2 codes, but some do not display all manufacturers’ “enhanced codes”. Only professional level scan tools (which are expensive) have the bi-directional capability and the proper software for accessing and running the tests needed for many of today’s vehicle systems. Specific details on the cost of the devices, as well as the software license fees for each of the OE’s can be found on the National Automotive Service Task Force’s website, and can cost anywhere from $1,000 to $7,000 annually for the service information subscription alone. For a single repairer potentially working on many different vehicle makes these costs can add up very quickly. The other alternative for shops not wanting to make that investment is to use the single asTech2 scanning device from Collision Diagnostic Services. The shop is charged a flat fee for each pre-repair and post-repair scan, and the direct access to the OEM scan tool information provided. Analysis of uploaded vehicle appraisals reveal the cost per scan ranges anywhere from $75 to $169; reflecting the fees charged to the shop for each scan by CDS as well as additional labor time sometimes added by the shop for the time spent running the scan. Scan fees are incurred whether DTC fault codes are found or not. And none of the costs to complete a scan include the costs often required to buy the tools needed to recalibrate the different OE ADAS systems.
During a recent panel at NACE 2016, numerous OE’s, insurance carriers, and other industry representatives discussed the challenges now facing the industry as the rapidly changing vehicle technology is now requiring additional steps be taken in the repair process that today are potentially costly, vary by vehicle manufacturer and by different technologies. All industry parties are interested in ensuring the vehicle is repaired properly, so systems such as a lane departure warning system, reverse sensors, etc. are recalibrated properly and not potentially misaligned leading to another accident down the road, or where something like a navigation system or even an air conditioning system has issues later identified by the dealer as related to the prior accident. These types of scenarios lead to an unhappy customer – unhappy with the insurance company, the body shop, the dealer, and even perhaps the car itself. Potential for liability on the part of the repairer or the insurer if something is left unrepaired is also of concern.
Finally, all of these additional costs couldn’t come at a worse time for the insurance industry. Several years of significant increases in claim frequency due to weather, higher employment, more miles driven, more vehicles on the road, greater driver distraction, crumbling infrastructure, etc. have led to more claims, at a time when the industry is beginning to see both higher total loss and vehicle repair costs. At the same time, investment returns for the industry have not been good, and combined with higher loss costs have led to worse financial results overall. For the first six months of 2016, the property casualty insurance industry’s combined ratio rose to 100.0 from 97.8 for the same period in 2015. 28
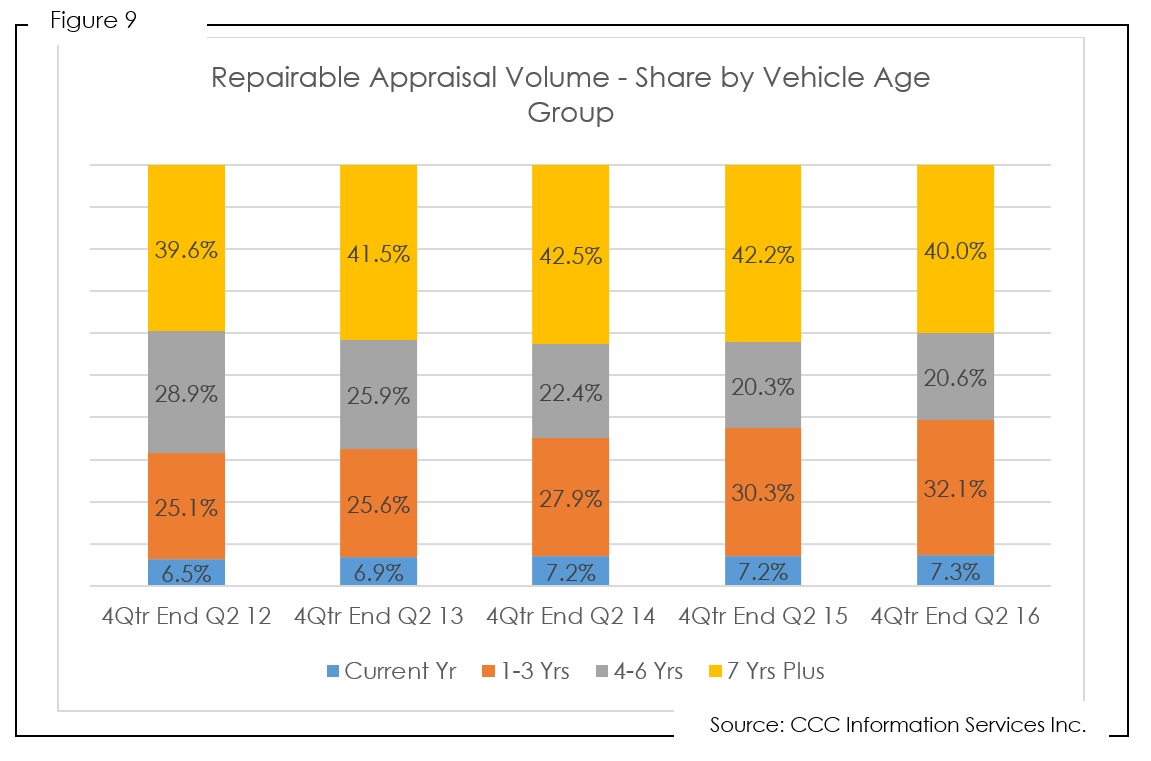
For the four quarters ended Q2 2016, the average vehicle repair cost for collision and liability losses was $2802, up over 3 percent from the same period prior year. Repair costs for the newest vehicles are ramping up most, up 4.8 percent in the last 12 months, versus up only 2.1 percent for vehicles aged 4-6 years. At the same time a growing share of repairable claims are for the newer vehicles (see Figure 9).
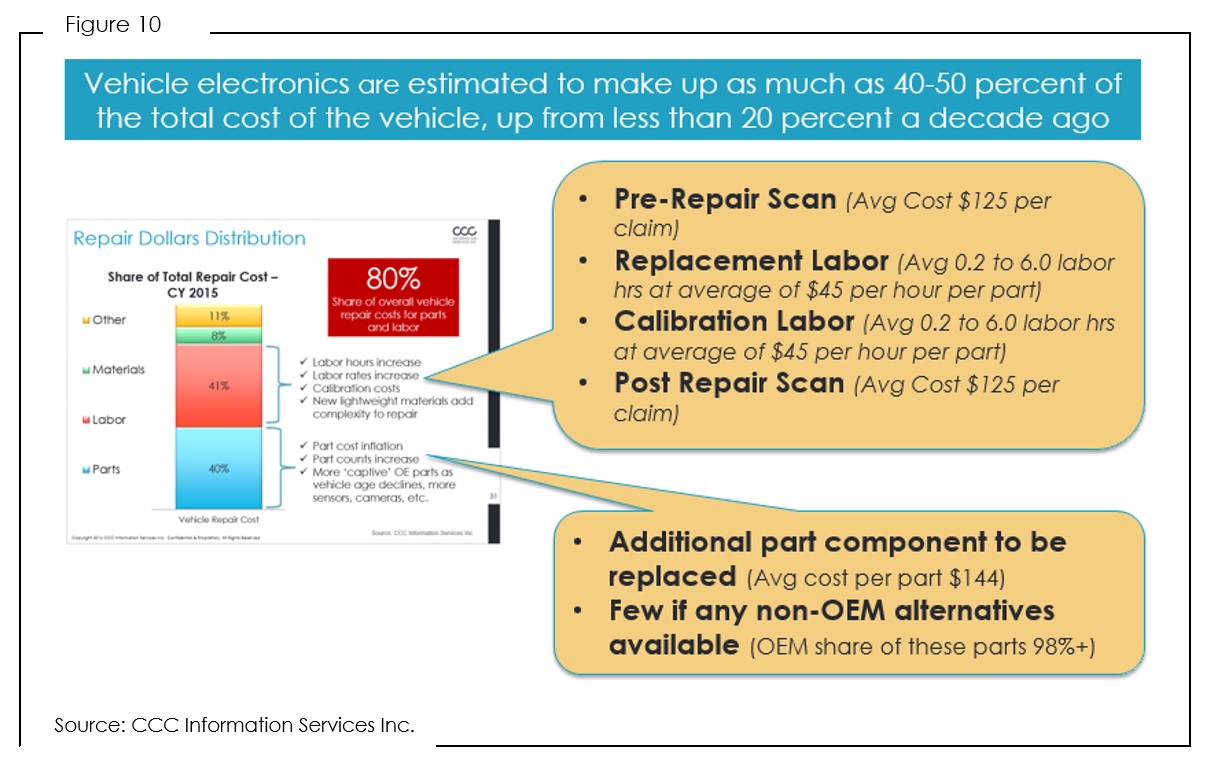
As more and more vehicles include advanced vehicle features, whether designed for safety or convenience, vehicle complexity continues to grow. Growth in electronic vehicle content – items added to address vehicle safety or convenience (none of which were needed previously for the vehicle to simply operate in the past i.e. getting from point A to point B) are adding to the overall cost of repair.
With over 80 percent of the cost of the vehicle repair from labor and replacement parts, the industry is experiencing further increases in both. As the information in Figure 10 illustrates, labor needed for part replacement, calibration, reset and scan as well as the cost of additional parts can add hundreds of dollars in additional fees.
When the technology can help avoid the accident, or at least mitigate it by slowing the speed of the vehicle before impact, the HLDI data in Figure 5 above does show not only reduction in frequency but also in severity when compared to other vehicles not equipped with those same systems. However, in some cases, claim costs have trended higher, and greater vehicle complexity driving both the cost and complexity of the repair are certainly a major factor.
Moving forward the challenge for insurers will be to assess how declines in frequency might help to offset inevitable increases in vehicle claim costs. The next several years are going to be challenging, as automakers compete to position themselves for the changing world of personal mobility, introducing more and more technology that will be expensive to repair, and may not deliver on all of the promises out the gate in terms of accident prevention.
_____________________________________________