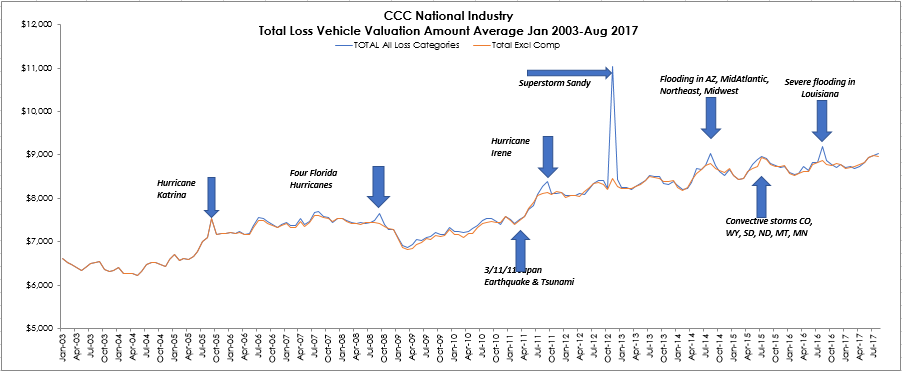
To understand potential impact of Harvey on insurance losses to date, a comparison to past events can be instructive. The following graph illustrates the impact on just total loss costs from several major weather events between 2003 and 2012. Superstorm Sandy was by far the most impactful, with both the volume and cost of the losses exceeding many of the prior large events.
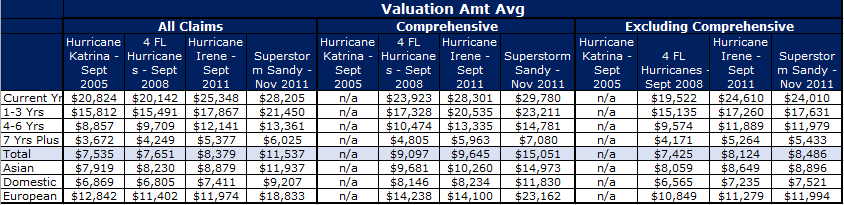
The following chart illustrates the overall impact at a national level when large scale events such as Hurricane Irene or Superstorm Sandy result in many total loss vehicles. For example, without the comprehensive total losses from Sandy, the average total loss value for November 2012 was only $8,279. With the Sandy losses included the national average jumped to an average of over $11K.
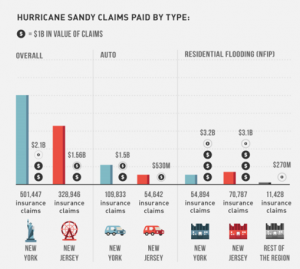
Superstorm Sandy resulted in over 160K auto losses, and was one of the largest volume of losses in a single event[i]. Just last year, in mid-August 2016, Louisiana experienced torrential rainfall – three times as much rain as in Louisiana during Hurricane Katrina, with flood damage to 60,000 homes, over 100,000 vehicles, and multi-billion dollar losses.
Scientists at the National Oceanic Atmospheric Administration (NOAA) concluded after their rapid-response study of the event that climate change made this rainfall event at least 40 percent more likely today than in 1900. They also concluded that 1-in 30 year events have become 10 percent more intense since preindustrial times.
A comparison of the losses experienced among these various major weather events underscores how the vehicle mix within a given geographic area can lead to much higher or lower loss costs. For example, analysis of total loss vehicle valuations by CCC shows the mix of vehicles in the areas impacted by Sandy included more newer and non-Domestic vehicles. And, when compared to other events that occurred in Louisiana and Florida, the average comprehensive total loss valuation was over $15K versus about $9K-$10K for the other major events (see table below).
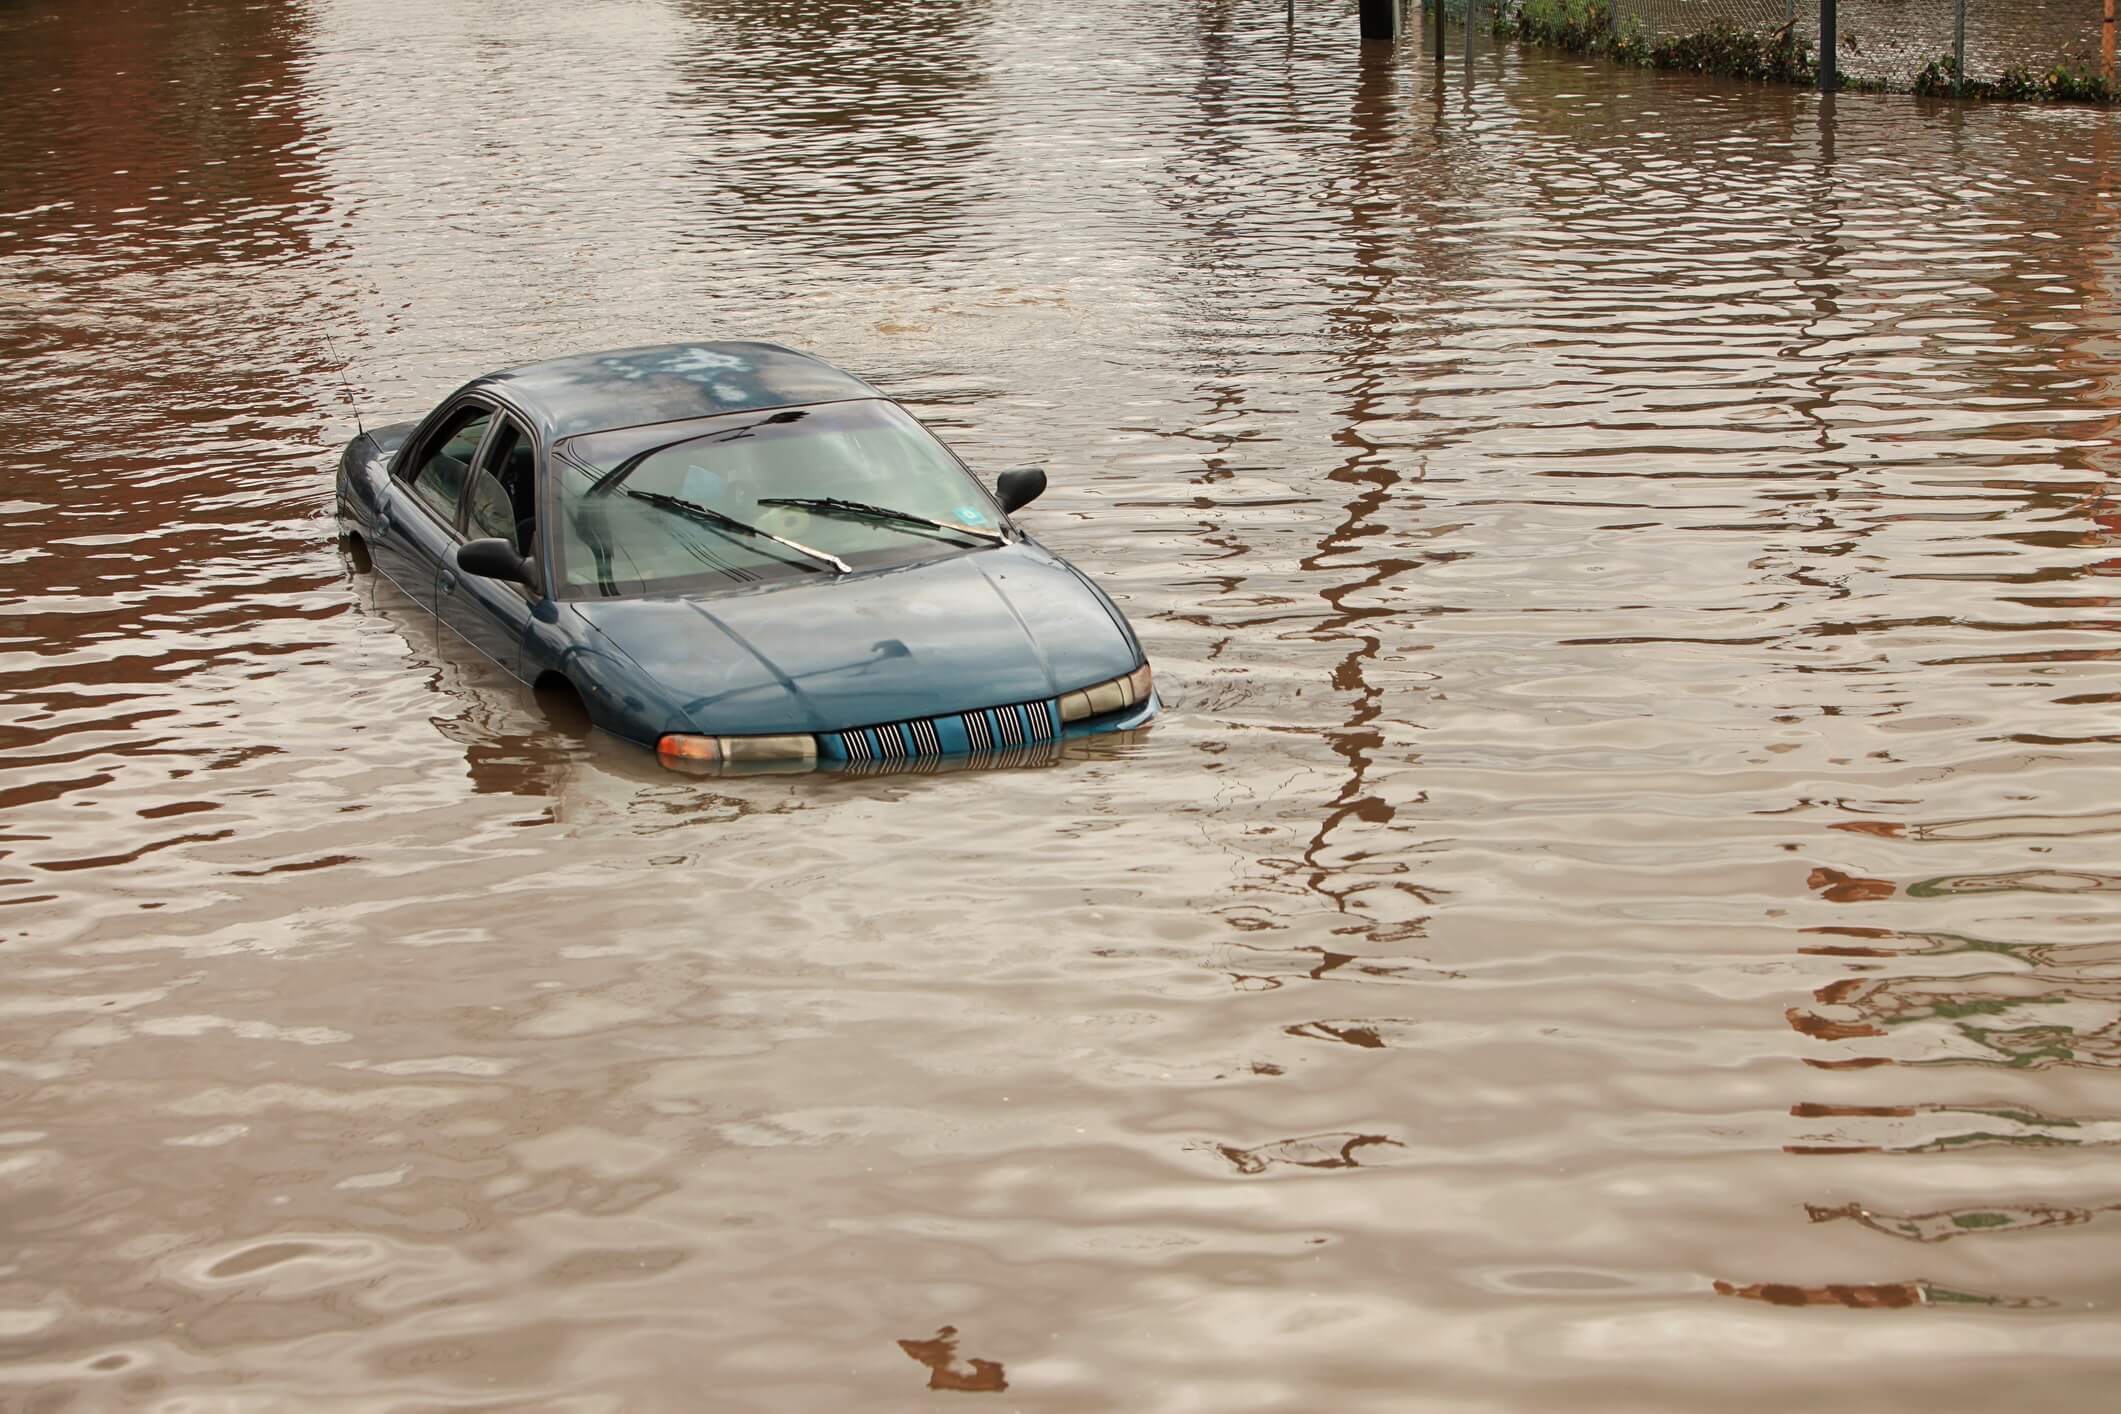
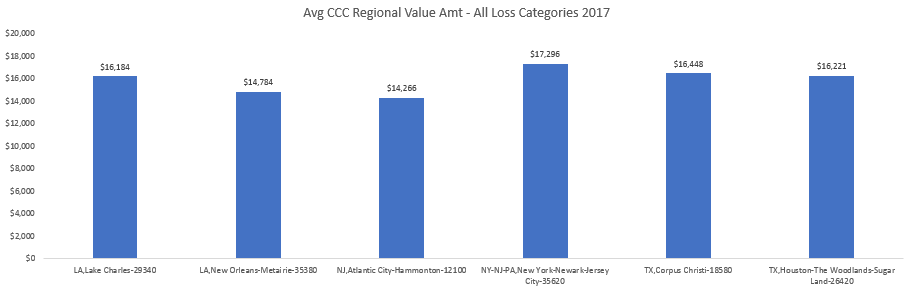
In order to understand what might be the potential impact of Harvey, two key variables must be know – number of potential losses and their likely loss cost. Given the nature of Harvey, the vast majority of loss vehicles will be total loss flood vehicles. Understanding what the likely market value of vehicles underwritten in a given zip or county impacted by the storm may help quantify the likely loss costs of those claims. For example, analysis of 2017 year-to-date losses in the areas that are likely to see the most impact from Harvey reveal values of vehicles are slightly less than those in the areas impacted by Sandy; however, not by much.
35 counties to date have been declared disaster zones, and up to as many as 50 have been impacted in some manner by Tropical Storm Harvey, which is dumping rain over the region of 6 million people, including 2 million in Houston alone. Between 2000 and 2010, the population in Houston grew by over 100K.
The impact to the overall economy is also expected to be significant. Already on Monday August 28, U.S. gasoline futures jumped to two-year highs, and the U.S. dollar dropped to a 16-month low against a basket of currencies.[i] So far Harvey has knocked out one quarter of oil and natural gas production from the Gulf of Mexico, driving concern that years of excess U.S. oil capacity and low prices could be ending.[ii] After Katrina in August 2005, U.S. economic growth more than halved in the quarter, but bounced back by early 2006 as reconstruction began and gasoline prices moderated.
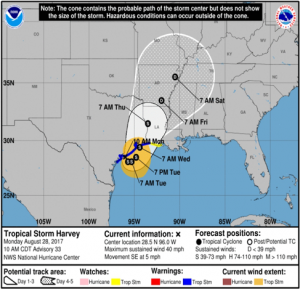
Some key points from the latest data from the National Hurricane Center: [i]
“Tropical Storm Harvey Discussion Number 32
NWS National Hurricane Center Miami FL AL092017
400 AM CDT Mon Aug 28 2017
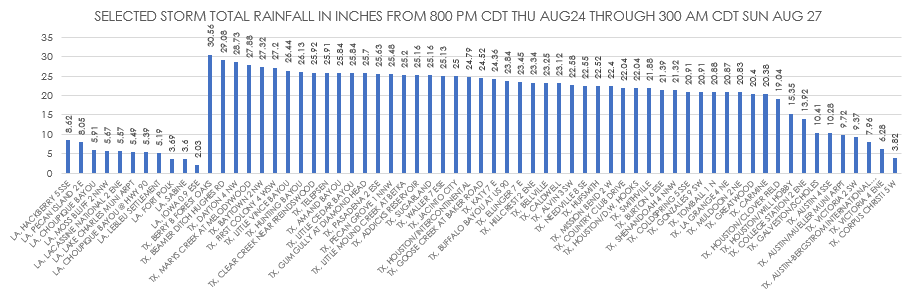
Harvey is producing intense convection in bands over the eastern semicircle of the circulation. This is resulting in the continuation of very heavy rains and life-threatening flash flooding over southeastern Texas and southwestern Louisiana. There have been reports of 2-day rainfall totals of close to 30 inches in the Greater Houston area. With the additional rains that are expected over the next several days, rainfall totals could reach 50 inches in some locations, which would be historic for the area.
1. Ongoing catastrophic and life-threatening flooding will continue across southeastern Texas. Additional rainfall accumulations of 15 to 25 inches are expected across the upper Texas coast, with isolated storm totals as high as 50 inches. Please heed the advice of local officials. Do not attempt to travel if you are in a safe place, and do not drive into flooded roadways. Refer to products from your local National Weather Service office and the NOAA Weather Prediction Center for more information on the flooding hazard. 2. The flood threat is spreading farther east into Louisiana. Additional rainfall amounts of 15 to 25 inches are expected in southwestern Louisiana, with rainfall amounts of 5 to 15 inches expected in south-central Louisiana. Please heed the advice of local officials and refer to products from your local National Weather Service office and the NOAA Weather Prediction Center for more information on the flooding hazard in these areas.”
As of early Monday Aug 28th, rainfall accumulations had been astounding:
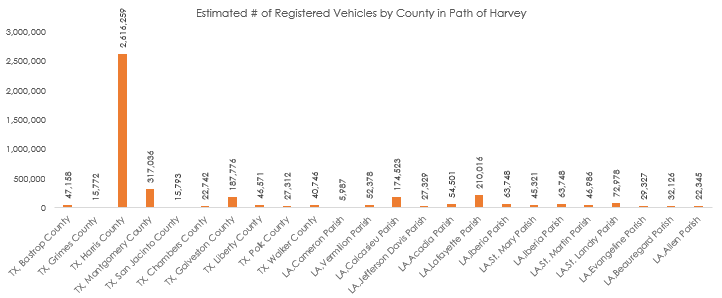
In the Houston area as of 2007, there were an estimated 570 vehicles per 1000 residents.[i] Looking at many of the hardest hit counties to date, there are potentially over 4 million vehicles at risk of flooding. When Tropical Storm Allison hit in 2001, 95,000 vehicles were flooded, a time when nearly 100K fewer people lived in Houston.
And the storm is not over – more rain is expected. Additionally, the U.S. Army Corps of Engineers started a controlled release of water from several dams throughout the Houston area, with spillways and roads in the vicinity likely impacted.[i] The Brazos River alone may reach river levels of 56.1 feet, nearly two feet above the record during flooding in 2016.[ii]
 In fact, latest forecasts from NOAA are for Houston to receive 6-10 more inches; New Orleans to receive 6-10 inches; Baton Rouge to receive 4-6 more inches, and Shreveport to receive 1-2 more inches.
Clearly this is a storm of historic proportions – some have called it a 1000-year flood. What’s also clear is that losses will continue to grow, and it will be weeks, months, and perhaps even years before the area will fully recover from this storm.
Click here to download the full PDF.
The information and opinions in this publication are for general information only, are subject to change and are not intended to provide specific recommendations for any individual or entity. Although information contained herein has been obtained from sources believed to be reliable, CCC does not guarantee its accuracy and it may be incomplete or condensed. CCC is not liable for any typographical errors, incorrect data and/or any actions taken in reliance on the information and opinions contained in this publication. Note: Where CCC Intelligent Solutions is cited as source, the data provided is an aggregation of industry data related to electronic appraisals communicated via CCC’s electronic network or from total loss valuations processed by CCC.
[1] http://www.huffingtonpost.com/2013/10/29/hurricane-sandy-impact-infographic_n_4171243.html
[1] Ibid.
[1] Ibid.
[1] http://www.nhc.noaa.gov/text/refresh/MIATCDAT4+shtml/241455.shtml
[1] http://www.city-data.com/forum/city-vs-city/653396-metro-areas-ranked-vehicles-per-1-a.html.
[1] http://www.cnn.com/2017/08/28/us/harvey-houston-texas-louisiana/
[1] Ibid.