
(This article was first published in Claims Journal.)
2015 was in many ways a break-out year, where the automotive insurance and collision repair industries emerged from an almost eight year hiatus or pause in historic trends for automotive claim frequency. 2016 will likely see continuation of many of the trends experienced in 2015, but also provide us more visibility into what we can expect for the next several years.
Claim frequency has essentially returned to the levels last seen pre-recession. Driving this are several factors, including improved economy, more miles driven, and erratic and significant weather events. An increase in new vehicle sales means more of these vehicles are on the road and having accidents.
During the worst of the recession and immediate period following (2008 to 2010) miles driven showed a year-over-year decline each month of 0.8 percent.1 Between 2011 and 2014, the monthly year-over-year growth in miles driven averaged just 0.2 percent.2
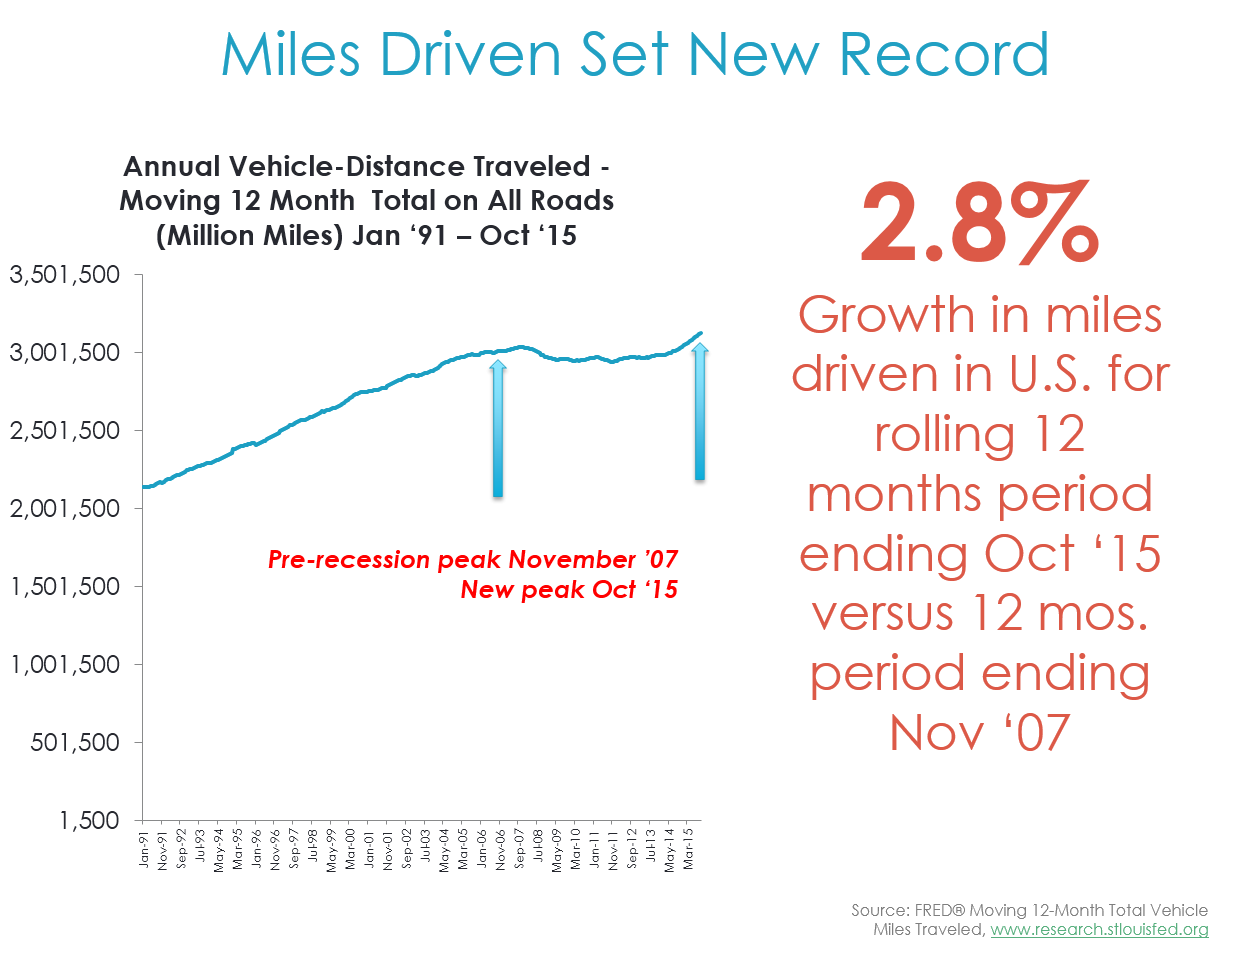
Finally, in 2015 miles driven began to ramp up faster, and have now exceeded the peak miles last seen in 2007. Comparing the data on miles driven for the rolling 12 months ended September 2015 to the twelve months ended November 2007, there is a 2.7 percent increase in miles driven in the U.S.3 A stronger U.S. economy is one key factor driving the increase in miles driven.4
Perhaps most important as an indicator of rising exposure per vehicle is the up-tick in the miles driven per vehicle, which has also returned to levels last seen in 2007.5
Record low gasoline prices have also been a factor leading to more miles driven. Many studies have been published that study the correlation of miles driven to gasoline prices.6 The premise is that people drive more and faster when gas prices are lower, and that they will be less likely to use public transportation.7 And with the decision by OPEC in early December 2015 to maintain its current barrels per day production levels of oil, prices have fallen below $40 per barrel and will remain low until the supply/demand balance is restored.8 Currently there is more supply than demand, and countries like Saudi Arabia and Iran don’t appear to be prepared to cut their production anytime soon.9
Barring any major economic slowdown, and depending on continued growth in registered vehicles in the U.S., we can expect claim frequency to experience further moderate increases over the next several years, until market penetration of collision avoidance systems and potentially even early generation autonomous vehicles help to drive down claim frequency in a meaningful manner beginning in 2020.10
Estimates from the Insurance Institute for Highway Safety suggest that nearly half of all MY15 vehicle models had front crash prevention as a standard or optional feature.11 This number is anticipated to grow even further among MY16 and newer vehicles.12 Analysis of the share of vehicles by model year and by loss coverage, as well as an estimation of the ‘take-up’ rate of crash avoidance systems based on availability and consumer purchase suggests the impact on auto claims to date has been relatively small.13 In fact MY15 and MY16 vehicles that offered collision avoidance systems (had distance sensors) as an option accounted for less than 2 percent of all vehicle claims year-to-date 2015 through Q3.14 However claims for vehicles with distance sensors available accounted for over 30 percent of all claims for MY15 and MY16 vehicles – so the impact to the industry surely will grow over time.15
In the ten years prior to the latest U.S. recession (CY 1997-2007), the average annual number of new vehicle sales in the U.S. was 16.7 million.16 Sales began to nosedive in CY 2008, and hit bottom in 2009.17 From 2010 forward sales have improved – in some years by double-digits, and the U.S. is on track for 17.3 million new sales in 2015, the most sales since the last record of 17.4 million set in CY 2000.18 The interruption in sales subsequently resulted in the mix of vehicles on the road in the U.S. today skewed to both the oldest and newest segments.
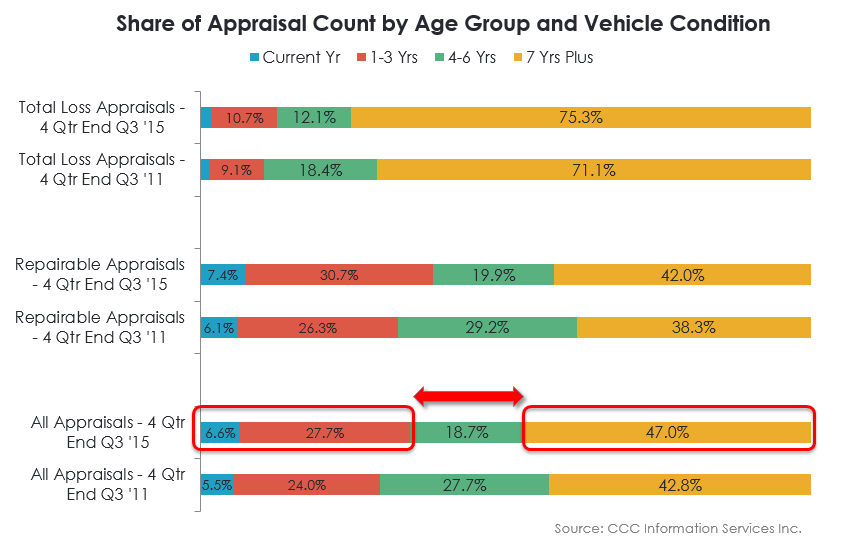
Seventy-two percent of vehicles on the road in the U.S. are still aged six years and older 19; and yet strong new vehicle sales have resulted in growth in the newest vehicle years. The chart (at left) illustrates this shift across all claims, and also specifically among repairable claims and total loss claims.
With newer vehicles accounting for a growing share of repairable volume again, the industry is experiencing a reversal in some of the trends experienced during the recession. Specifically, newer vehicles tend to have more parts replaced and a lower repair percent of total labor spend. Throw into the mix the fact that vehicles overall have gotten more complex, and these trends accelerate even further.
Consumers are also buying more light trucks again, as well as higher cost vehicles overall with higher MSRP’s. This is driving the changes in the claims mix as well beyond just the age distribution.
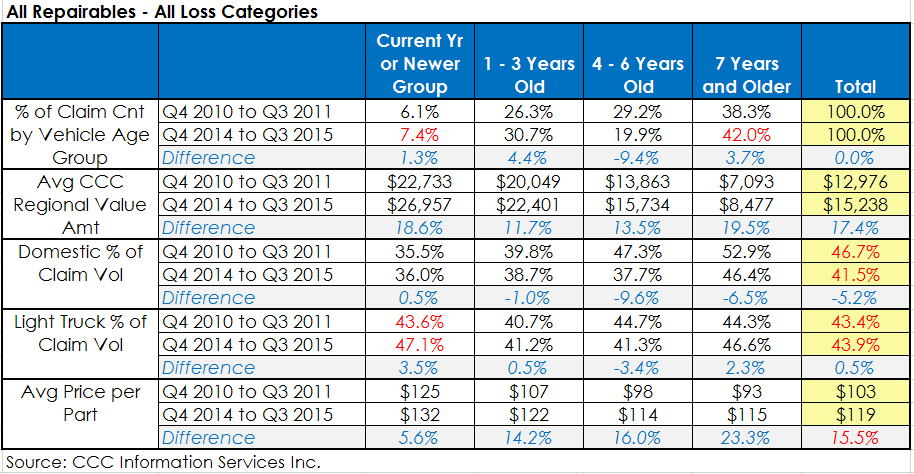
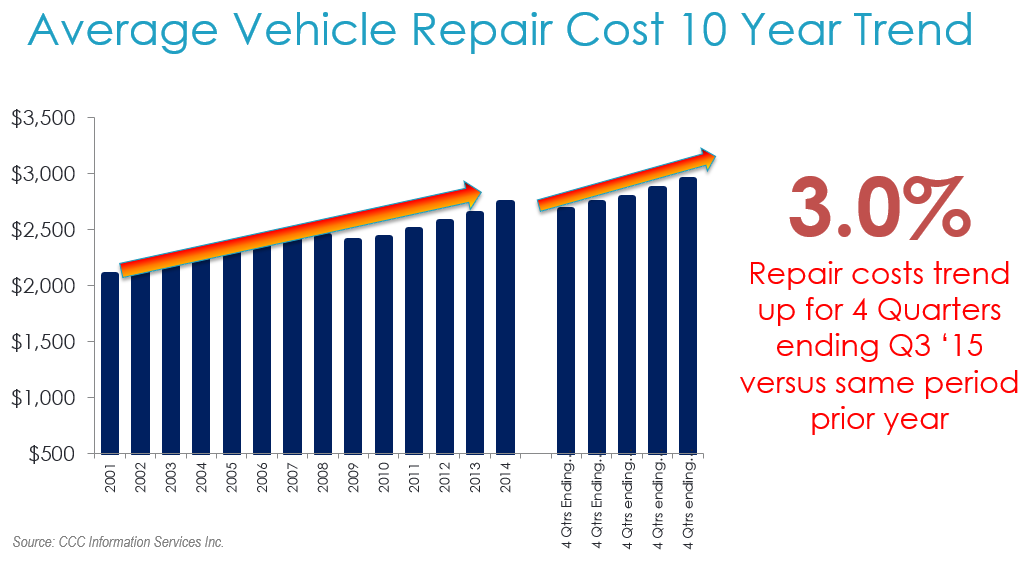
Growth in the average number of parts replaced per claim as well as more labor hours per claim largely account for the rise in repair costs.20 Increasing vehicle complexity – both in terms of the materials used in the construction of the vehicles as well as an increased number of standard options, are also helping to lift costs. Combine this with moderate inflation in part prices and labor rates (see table above), a 3-4 percent increase in overall repair costs is the result. This puts the industry in line with where it had been historically before the recession.
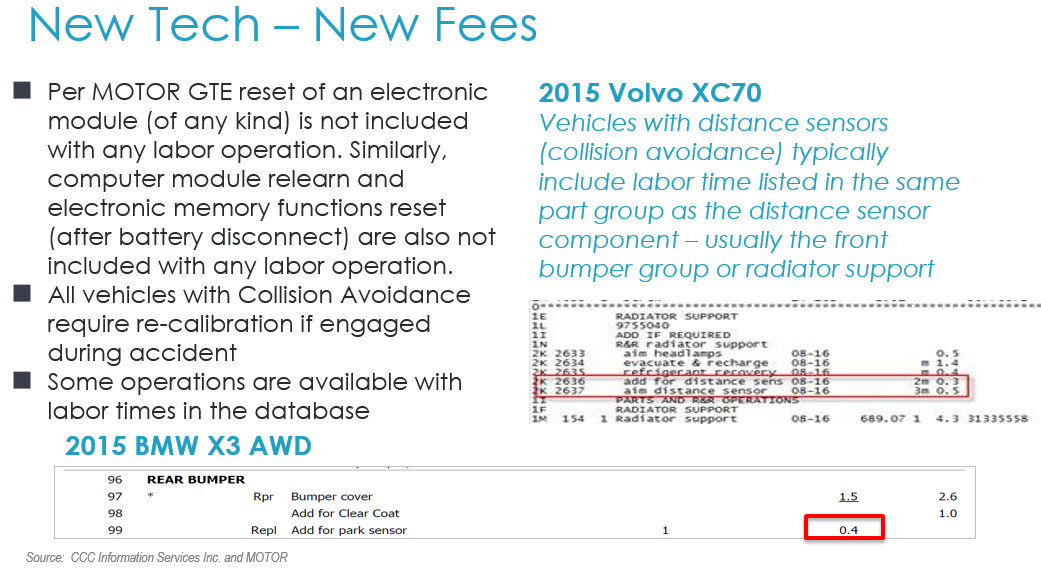
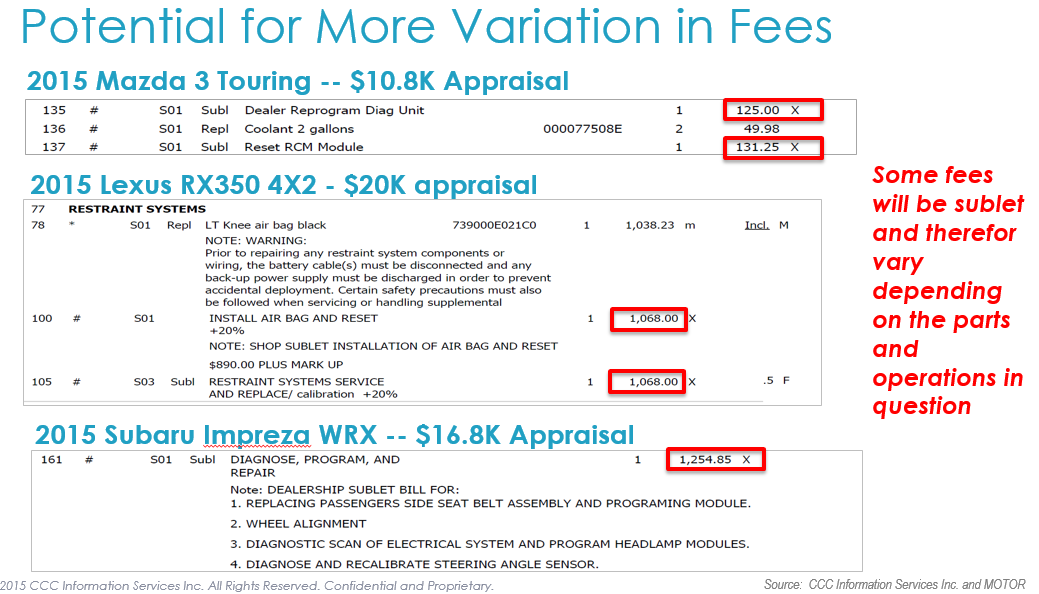
Look inside any new vehicle today and a quick visual scan of the dashboard and interior illustrates how much more complex today’s vehicles are from those manufactured even ten to twenty years ago. New vehicles manufactured today are changing the landscape for insurers and collision repairers. Greater vehicle complexity from lightweight materials, complex construction, sensors and cameras demands the industry have access to information on how to properly repair the vehicle, and to the necessary equipment, tools and training to repair the vehicle correctly. Time to recalibrate sensors and cameras is not included in the replacement labor time, and may vary depending on the complexity of the systems.
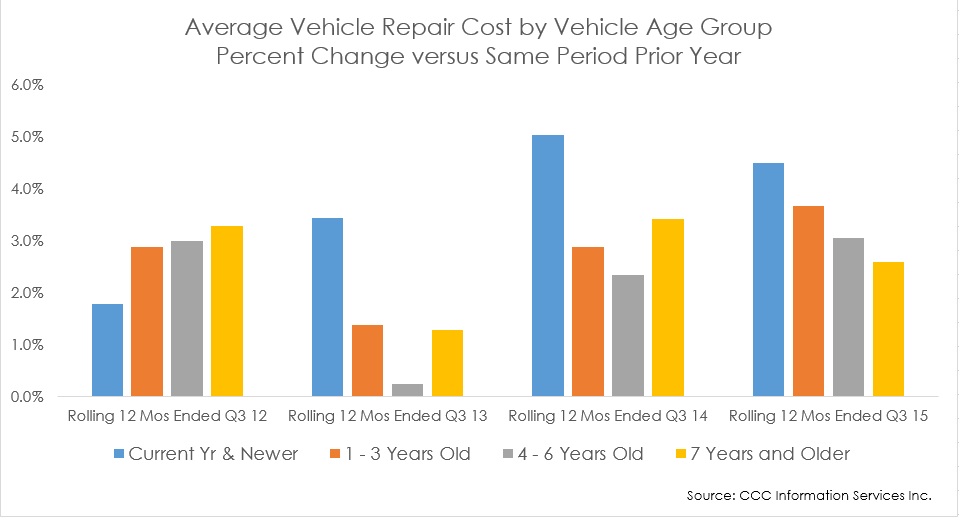
In fact, comparison of year-over-year increase in average vehicle repair costs by vehicle age group shows the newest vehicles have seen the largest increases in the last two years.
Subsequently, near term the industry will likely see further increases in both frequency and claim costs. Combined claim costs, accounting for both repairable vehicles and total loss, will likely see increases between 3.5 and 5 percent annually in 2016 and maybe even 2017. Gas prices remain low, unemployment rates are down, miles driven are up, and both new and used vehicle sales were strong in 2015 and are anticipated to see further moderate increases in 2016.21 Subsequently CY 2016 and CY 2017 will likely see moderate increases in frequency in line with what was seen in CY 2015, until the new crash avoidance technology has taken firmer hold in the marketplace.
__________________________________________________
Sources:
[1]FRED® Moving 12-Month Total Vehicle Miles Traveled, www.research.stlouisfed.org.
[2] CCC calculations based on data from http://www.fhwa.dot.gov/policyinformation/travel_monitoring/tvt.cfm.
[3] FRED® Moving 12-Month Total Vehicle Miles Traveled, www.research.stlouisfed.org.
[4] Ibid.
[5] CCC calculations based on miles driven data sourced from the U.S. DOT FHWA Office of Highway Policy Information Travel Monitoring reports (http://www.fhwa.dot.gov/policyinformation/travel_monitoring/tvt.cfm) and registered vehicle counts sourced from NADA DATA 2014 (www.nada.org/nadadata).
[6] (e.g. Kopits and Cropper, 2005; Scuffham, 2003; Sivak and Schoettle, 2010; Traynore, 2008, 2009). Guangqing Chi, Mohammed A. Quddus, Arthur Huang, David Levinson. “Gasoline price effects on traffic safety in urban and rural areas: Evidence from Minnesota, 1998-2007.” Safety Science 59 (2013) 154-162.
[7] (Chi et al., 2010, 2012, 2013; Grabowski and Morrissey, 2004). Guangqing Chi, Mohammed A. Quddus, Arthur Huang, David Levinson. “Gasoline price effects on traffic safety in urban and rural areas: Evidence from Minnesota, 1998-2007.” Safety Science 59 (2013) 154-162.
[8] Roemer, James. “Warm Winter in Many Countries Will Add to Woes in Energy Markets.” http://seekingalpha.com/article/3750186-warm-winter-in-many-countries-will-add-to-woes-in-energy-markets, Dec. 11, 2015.
[9] Ibid.
[10] CCC Intelligent Solutions
[11] Insurance Institute for Highway Safety / Highway Loss Data Institute. “Stopping Power: IIHS rates 19 new models for front crash prevention.” Status Report, Vol. 50, No. 7, August 30, 2015. www.iihs.org.
[12] Ibid.
[13] CCC calculations based on auto claims data from CCC’s data warehouse.
[14] Ibid.
[15] Ibid.
[16] Automotive News “U.S. total vehicle sales by make.” www.autonews.com http://www.autonews.com/article/20151202/DATACENTER/151209955/u-s-total-vehicle-sales-by-make-dec-ytd.
[17] Ibid.
[18] Automotive News “U.S. total vehicle sales by make.” www.autonews.com http://www.autonews.com/article/20151202/DATACENTER/151209955/u-s-total-vehicle-sales-by-make-dec-ytd.
[19] Experian Information Solutions, Inc. “Experian Automotive Quarterly Briefing: First Quarter 2015 automotive market share trends and registrations.”
[20] Ibid.
[21] Automotive News “U.S. total vehicle sales by make.” www.autonews.com http://www.autonews.com/article/20151202/DATACENTER/151209955/u-s-total-vehicle-sales-by-make-dec-ytd.