
(As published in Claims Journal.)
Numerous studies have been completed over the years that show consumer satisfaction with auto insurance companies is tied to their satisfaction with the vehicle repair. Consumers say they want more visibility throughout the claim and repair process, and prefer information be sent to them on the device and at the time of their choosing. In fact, results of a recent analysis of CCC ONE® UpdatePlus CSI survey details conducted by CCC’s analytics team found the quality of the repair, customer service and managing customer expectations by keeping them informed throughout the repair are what customers value the most. As a result, more repairers and insurers are taking a more active role in managing both cycle time and claim satisfaction, using mobile and digital technology to enable greater consistency and better automation in communication about the repair among all parties.
Cycle Times Grow Despite Greater Focus
Both repairers and insurers have begun to more actively monitor the differences between the planned and actual events for key process steps such as vehicle in, repair start, repair complete and vehicle out, with the goal to shave wasted time off of the claim and repair process and streamline communication between all parties.
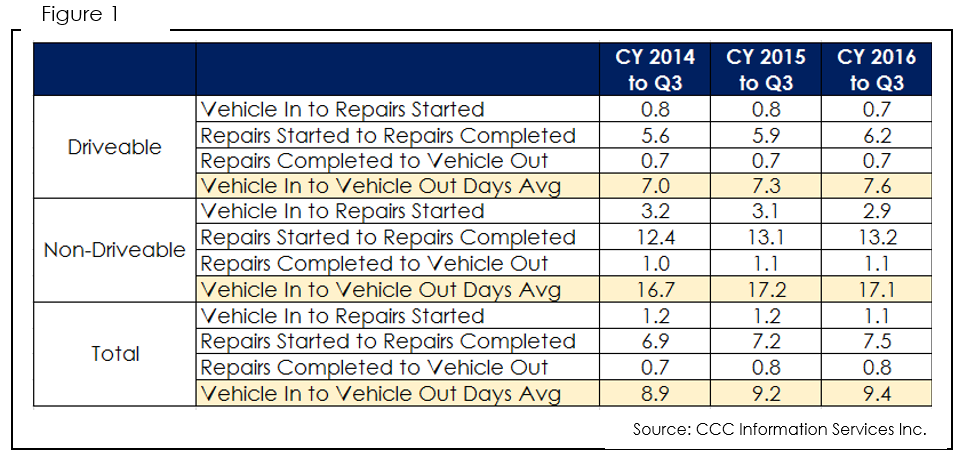
The average days between vehicle in and repair start, and the average days between repair complete and vehicle out have essentially remained unchanged over the last three years. Each averages slightly less than one day, whether the vehicle is driveable or non-driveable, and remain an opportunity for the industry to further streamline check-in and check-out.
Over the last three years, the average number of days from the date the vehicle is brought into the shop to the date it is picked up (a 24 hour / 7 day measurement), or “keys to keys” has grown from 8.9 days to 9.4 days.
As the data in Figure 1 illustrates, nearly all of that increase has occurred in the actual repairs started to repairs completed portion of that overall figure, with an increase of more than half a day.
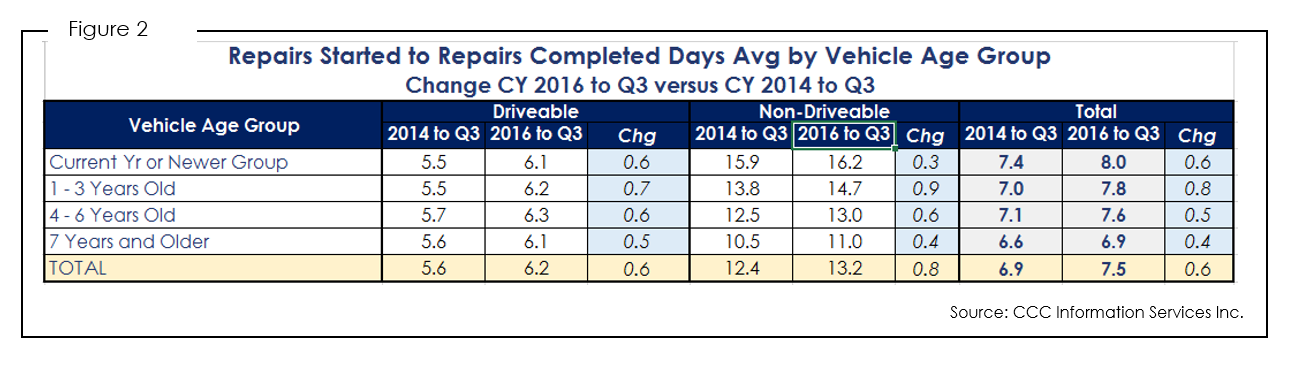
With increases in both the average number of labor hours per claim, and the average number of parts replaced per claim, it is clear that vehicle complexity is playing a part in driving up overall cycle time. A comparison of the repair time by vehicle age helps underscore how newer non-driveable vehicles have repair cycle times that dramatically exceed those of the older models. For year-to-date 2016, a current model year non-driveable vehicle had an average repair cycle time of 16.2 days, versus a vehicle aged 7-years plus of only 11 days (see Figure 2).
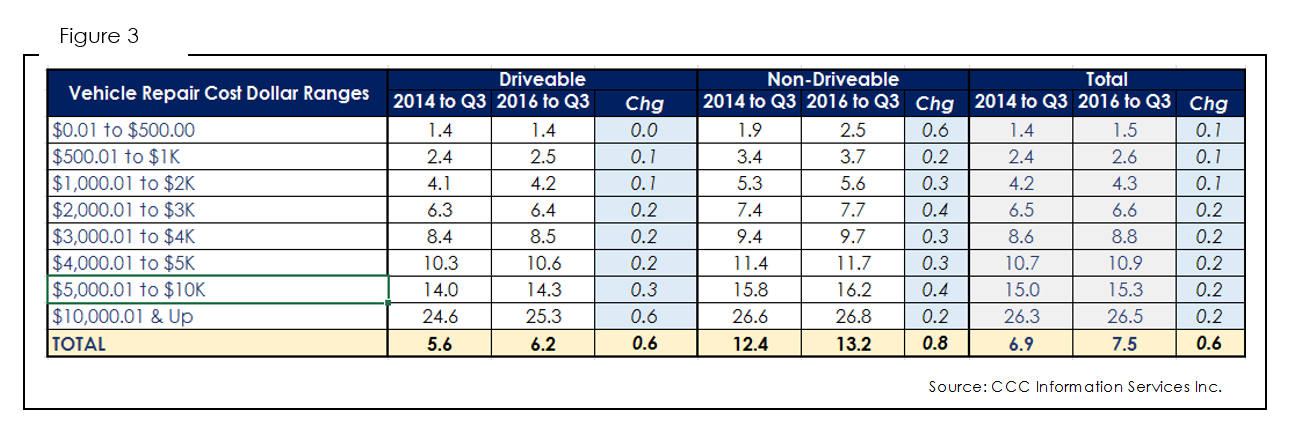
Previous articles have discussed the differences in repair costs by vehicle age, where more part replacements and labor hours for newer model year vehicles drive up repair costs. As repair costs climb, so do cycle times (see Figure 3). The fact that the non-driveable repair times have increased the most over the last three years also underscores how even low dollar repairs such a headlamp replacement that might deem a vehicle non-driveable has increased by over half a day.
A comparison of the average labor hours per repair day (measured as total labor hours divided by the number of days from repair start to repair complete) suggests that the industry is most productive where most of their volume is. For example, Figure 4 shows that in year-to-date 2016 through Q3, over 50 percent (33.6% + 21.1%) of driveable repairs fell in the two dollar ranges from $1000 to $3000, where average labour hours per repair day were 3.8 days.
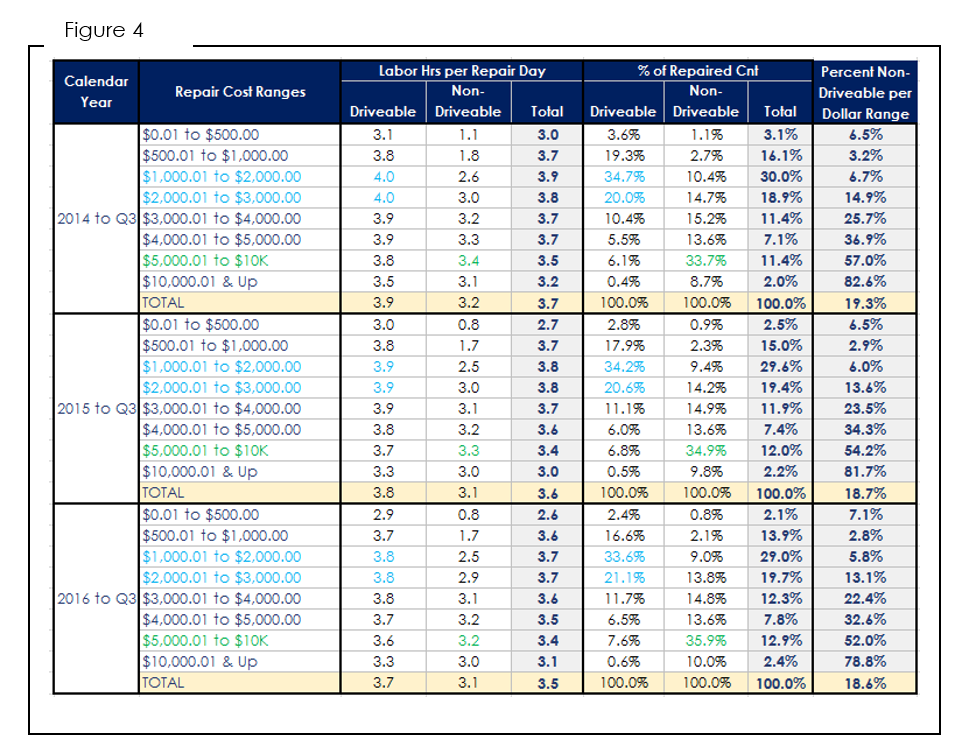
Additionally, across all three years shown in Figure 4, the majority of non-driveable volume fell in the repair cost dollar range of $5,000.01 to $10K, where the labor hours per repair day were the highest among all non-drive repairs. This data underscores the efficiency of the industry when repairs are similar in dollar value and perhaps complexity.
As repair costs rise, efficiency, not surprisingly, falls. While the overall average of labor hours per repair day was 3.7 hours for vehicles from $1K to $3K, productivity fell as the repair costs rise. Also worth noting is the gradual shift across the board to higher dollar repairs – for example among driveable vehicles the share of volume for vehicles with repair cost of $4,000.01 to $5K grew a full percentage point over the three years (increase from 5.5 percent in 2014 to Q3 to 6.5 percent in 2016 to Q3). Given the percent of vehicles deemed non-driveable has actually fallen during that time (from 19.3 percent in 2014 to Q3 to 18.6 percent in 2016 to Q3), greater vehicle complexity appears to be the culprit of higher repair costs and cycle times.
How Have Weather Events Affected Cycle Time This Year?
On a national basis, automotive claim frequency is up. The reasons for this include numerous factors such as more miles driven overall on a per vehicle basis as well as more vehicles on the road overall.
Severe winter weather, greater driver distraction, higher speed limits, more road congestion, and more miles on the interstate have also been blamed.
Figure 5 shows the change in automotive claim frequency per rolling four quarter since third quarter 2012 by coverage.
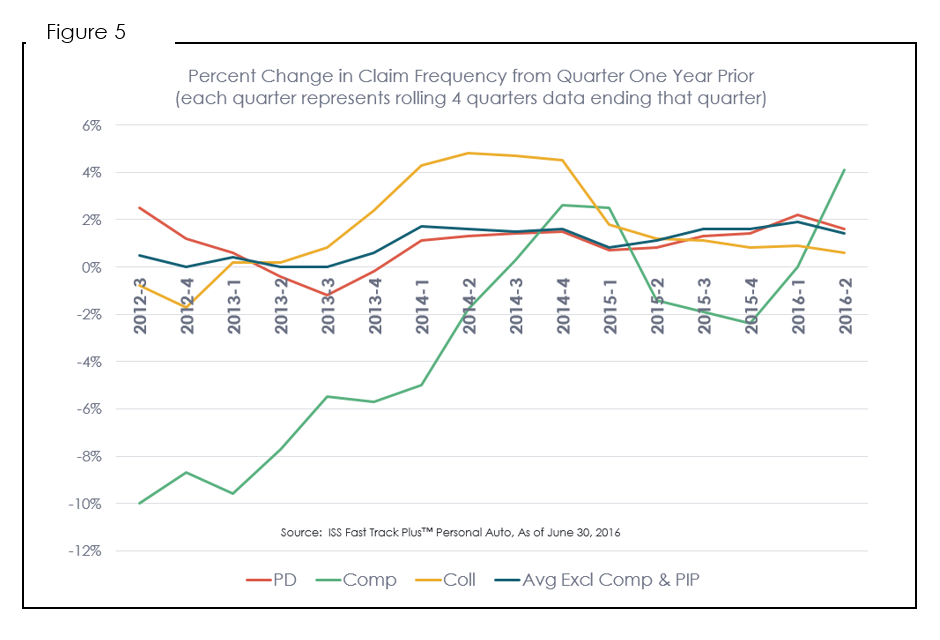
Collision frequency had increased quite a bit in 2014, but has since trended down, although it continues to rise slowly, with the latest data for the rolling four quarters ended Q2 2016 up 0.6 percent. Property damage liability however has seen larger increases more recently across a larger number of quarters, with it up 1.6 percent as of the four quarters ended Q2 2016.
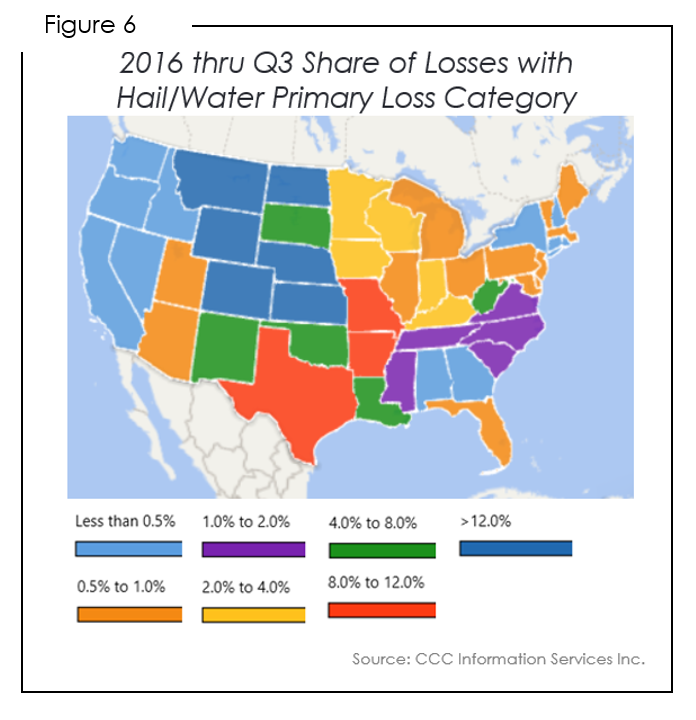
Meanwhile, comprehensive loss frequency has fluctuated the most, with frequency down sharply in 2012 through 2014, and one of the largest increases occurring in 2016. Year-to-date through Q3 2016, states such as Montana, North Dakota, Wyoming, Colorado and others have seen more than 12 percent of all losses where the primary impact listed was either hail or water (see Figure 6).
Texas was among the hardest hit. In the first six months of 2016 alone, Texas was hit by 14 catastrophe events and an estimated $7.6 billion in industry losses, with wind and thunderstorm events in the early spring alone accounting for $4.8 billion.1 Colorado Springs, CO was walloped with tennis-ball size hail July 28, 2016, resulting in over 50K auto insurance claims.2
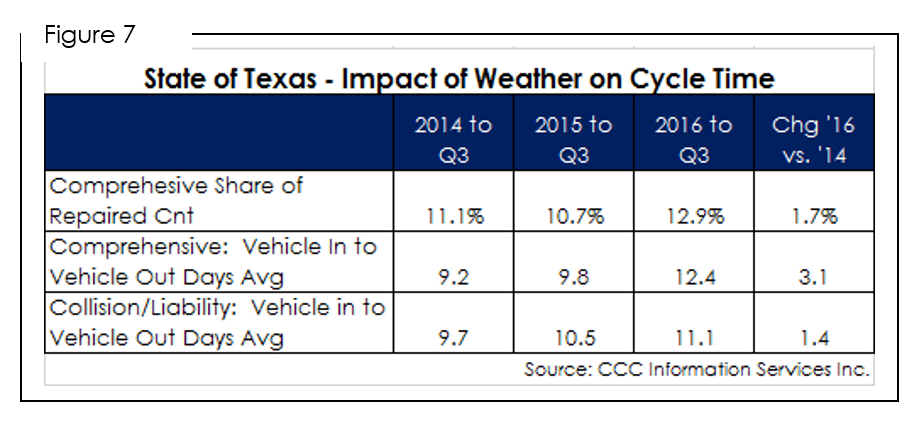
Hail storms in particular can lead to significant increases in vehicle repairs. The size and shape of the hail in several of the large storms in Texas led to higher total loss frequency, but also led to approximately 15 percent more repairs for the industry in 2016 through Q3 versus the same period in 2015. That surge in volume meant many shops were overwhelmed with cars – a good problem for repairers that unfortunately created a dent in repair cycle time overall. The “keys to keys” or vehicle in to vehicle out days average for comprehensive losses in Texas jumped to 12.4 days in 2016 through Q3 versus 9.8 days in the prior year. And while collision and liability losses also experienced an increase in keys-to-keys cycle time, the increase was smaller than for comprehensive losses.
Other states that saw increases in the keys-to-keys cycle time for comprehensive that exceeded the same metric for collision and liability losses were Wyoming, Nebraska, Colorado, and New Mexico, where large increases in comprehensive volume also occurred.
Cycling through the Days
Historically, repairers have used length of rental as a key indicator of repair cycle time. Standalone, one might intuit that an increase in average length of rental was trending up due to more heavily damaged vehicles, or a change in the mix of vehicles being repaired. Because not all claims include rental coverage, using metrics tracking the actual days from vehicle in to repair start, repair start to complete, and repair complete to vehicle out for all repairs can underscore whether a repairer can improve the vehicle scheduling process, opportunities for additional communication with customers to help give them better visibility into when the vehicle will be ready for pickup and avoid surprises that might lead to unplanned rental days.
Segmenting these data points further by vehicle characteristics such as those illustrated above can also help a shop identify why its repair and keys-to-keys cycle might be trending a certain way.
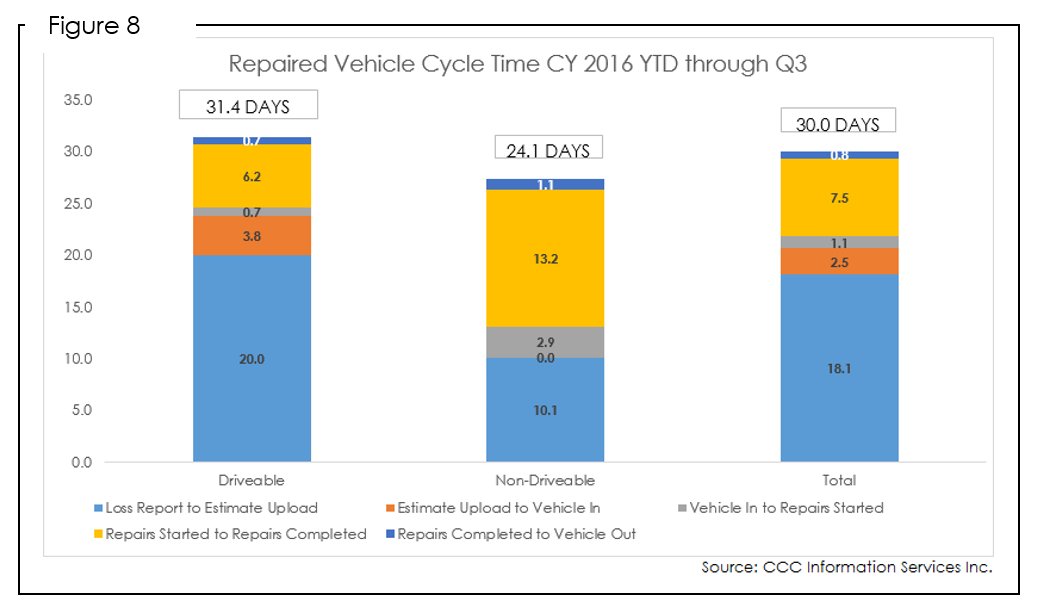
And finally, measuring cycle time all the way from the date the loss was reported through the date the vehicle is picked up by the consumer can help highlight inefficiencies between the various parties working that claim/repair. Between 2014 and 2016, the total number of days from the date the loss was reported to the date the vehicle was picked up by the customer after vehicle repair has actually fallen, from 32.9 days to 30.0 days.
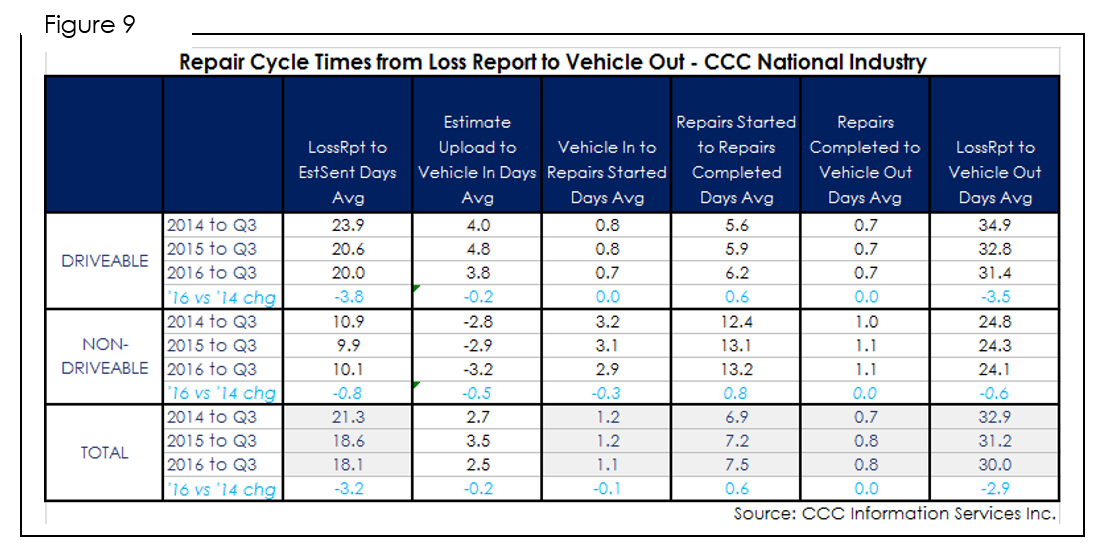
The biggest reduction in cycle time has occurred for driveable vehicles for the days from loss report to estimate upload, which trimmed 3.8 days from its average in 2014 through Q3. For driveable vehicles however, there still remains on average 20 days from the date the loss is reported to the date the initial estimate of record is locked and uploaded. While much of this may be dependent on the customer, a nearly four day reduction in three years suggests there may be further opportunity to focus on reduction in this step of the claims process; particularly as the industry will continue to face pressure going forward in repair times from increasingly complex vehicles.
_________________________________________________
Sources:
“US cat losses 20% higher than 10-year average with Texas hardest hit.” 01-09-2016. .
Heilman, Wayne. “July hail storm in Colorado Springs sixth-most damaging in state history.” August 22, 2016. http://www.gazette.com/.